Written Commentary
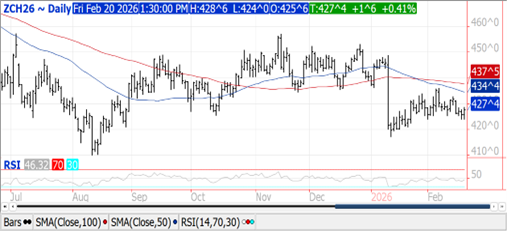
CORN
Prices were $.02-$.04 higher in choppy 2 sided trade. Spreads weakened as the nearby spreads made new lows. Mch-26 once again held support at this month’s low of $4.24 while holding within its $4.15-$4.40 range for another week. Yesterday’s EIA data showed ethanol production rebounded to 329 mil. gallons up from 326 the previous week which was in line with expectations at above the pace needed to reach the USDA corn usage forecast. Export sales at 58 mil. bu. were in line with expectations. YTD commitments at 2.452 bil. bu. are up 30% from YA, vs. the USDA forecast of up 15.5%. Commitments represent 74% of the USDA forecast, above the historical average of 67%. Shipments at 1.431 bil. are up 44% YOY. Noted buyers were Japan – 15 mil. and Mexico – 11 mil. COF as of Feb. 1st at 11.505 mil. head were down 2% from YA, in line with expectations. Placements at 95% were slightly below expectations while marketings at 87% were in line. Since 2010 the final endings stocks figure has been below the February USDA Forum forecast 11 of the 16 years.
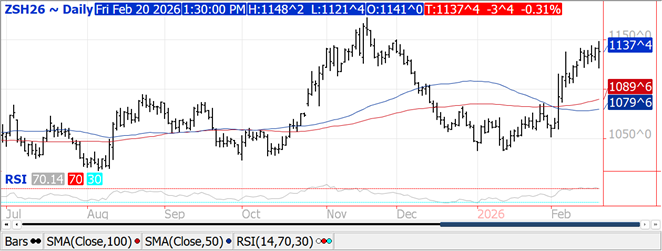
SOYBEANS
Early volatility slowed with prices closing mixed for the day however higher across the complex for the week. Beans were $.02-$.04 lower, meal was $3-$5 higher while oil was down 70-80 points. Bean spreads weakened while product spreads were mixed. The range for Mch-26 beans this week was set in today’s trade. Mch-26 meal surged to a 2 month high intraday. Mch-26 oil recovered much of the early weakness closing near the midpoint of today’s range. Bean oil is overdue for a correction after reaching fresh contract highs 5 of the past 7 sessions. Spot board crush margins jumped to a fresh 6 month high at $1.92 bu. up another $.06. Bean oil PV slipped back under 49%. Today’s volatility was driven by the SCOTUS ruling that the Trump Administrations use of tariffs under IEEPA were not legal. The high court ruled 6-3 against while it is still unclear how or when the estimated $175 bil. in tariff revenue collected will be refunded. Pres. Trump responded by declaring 232 and 301 tariffs remain fully in place and will impose a 10% global tariff on top of other tariffs. RIN’s (D4) generated from the production of biodiesel and RD plunged 35% in January, suggesting a sizeable drop in biofuel production. Bean oil usage for biofuel production in the 25/26 MY is forecast at 14.8 bil. lbs up 26% YOY, vs. the actual usage after 2 months of down 20%. Usage in 26/27 as forecast by the USDA Forum at 17.3 bil. lbs. up another 17%. Export sales at 29 mil. were in line with expectations. YTD sales at 1.30 bil. are down 19% from YA vs. the USDA forecast of down 16%. Commitments represent 83% of the USDA forecast in line with the historical average. Sales to China at 416k mt (only 68k switched from unknown) bring total commitments to 10.6 mmt with another 2.6 mmt to unknown. Shipments to China are just over 5.8 mmt. Egypt was another noted buyer at just over 8 mil. bu. Meal sales at 481k tons brought YTD commitments to 11,483k tons up 10% YOY vs. the USDA forecast of up 5%. Bean oil commitments at 771 mil. lbs. are down 49% YOY vs. the USDA forecast of down 52%. Since 2010 the final endings stocks figure has been below the February USDA Forum forecast 10 of the 16 years.
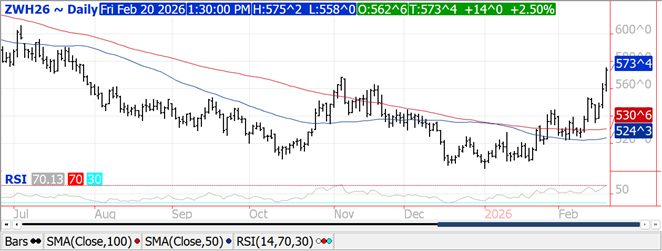
WHEAT
Prices ranged from $.05-$.14 higher with CGO futures again the leader to the upside. Both CGO and KC Mch-26 contracts surging to a 7 month high. Yesterday’s drought monitor showed US WW acres in drought rose 1% the past week to 46%, a 52 week high. With little rain in the forecast look for further expansion over the next few weeks. Wildfires and expanding drought in the southern plains has fueled the speculative buying. Russia Ag. Ministry kept their export tax at zero thru at least Mch 3rd. US export sales at 11 mil. bu. were at the low end of expectations bringing YTD commitments to 830 mil. bu. up 15% from YA, vs. the USDA forecast of up 9%. Commitments represent 92% of the USDA forecast, above the historical average of up 86%. Shipments are up 21%. By class commitments vs. USDA forecast are HRW +70% vs. USDA +49%, SRW +2% vs. -2%, HRS down 7% vs. -8%, and white down 4% vs. – 6%. Since 2010 the final endings stocks figure has been above the February USDA Forum forecast 11 of the 16 years.
Charts provided by CQG
Risk Warning: Investments in Equities, Contracts for Difference (CFDs) in any instrument, Futures, Options, Derivatives and Foreign Exchange can fluctuate in value. Investors should therefore be aware that they may not realise the initial amount invested and may incur additional liabilities. These investments may be subject to above average financial risk of loss. Investors should consider their financial circumstances, investment experience and if it is appropriate to invest. If necessary, seek independent financial advice.
ADM Investor Services International Limited, registered in England No. 2547805, is authorised and regulated by the Financial Conduct Authority [FRN 148474] and is a member of the London Stock Exchange. Registered office: 3rd Floor, The Minster Building, 21 Mincing Lane, London EC3R 7AG.
A subsidiary of Archer Daniels Midland Company.
© 2021 ADM Investor Services International Limited.
Futures and options trading involve significant risk of loss and may not be suitable for everyone. Therefore, carefully consider whether such trading is suitable for you in light of your financial condition. The information and comments contained herein is provided by ADMIS and in no way should be construed to be information provided by ADM. The author of this report did not have a financial interest in any of the contracts discussed in this report at the time the report was prepared. The information provided is designed to assist in your analysis and evaluation of the futures and options markets. However, any decisions you may make to buy, sell or hold a futures or options position on such research are entirely your own and not in any way deemed to be endorsed by or attributed to ADMIS. Copyright ADM Investor Services, Inc.
