Written Commentary
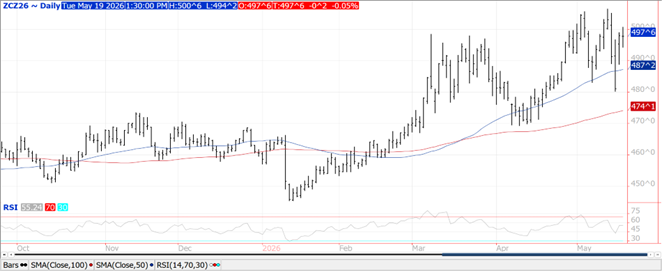
CORN
Prices were steady to $.02 lower in choppy 2-sided trade. Spreads also weakened. Resistance for July-26 is at its double top at $4.87 ½ while resistance for Dec-26 is at $5.06 ½. No date has been set for the US Senate to vote on E-15. Plantings advanced 19% to 76%, matching the YA pace while ahead of the 5-year Ave. of 70%. Plantings were in line with expectations. Emergence at 39% is below YA at 47% and just above the 5-year Ave. of 37%. I’d expect our first crop ratings next week. US corn is competitively priced with Brazil thru the end of summer while ranging from $10-$15 ton above Argentina. US corn is also roughly $100 per ton below China prices, near the long-term average. Historically when this gap expands to $150 or more, US sales to China take off. This differential is something that will be closely monitored by the trade. EU 25/26 imports as of May 17th at 15.98 mmt is down 10.5% YOY. Tomorrow’s EIA report is expected to show ethanol production recover to 323 mil. gallons last week, up from 318 mil. the previous week.
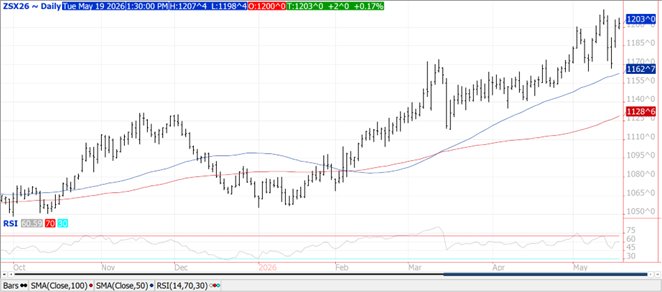
SOYBEANS
Prices were mostly lower across the complex with bean prices ranging from $.03 lower to $.02 higher, meal was steady to $2 lower while oil was 20-30 points lower. Bean and meal spreads weakened while oil spreads were mixed. Agricultural markets will continue to monitor signs of demand interest from China following Sunday’s fact sheet that outlined an agreement for them to purchase $17 bil. in US Ag. goods annually. This is in addition to the 25 mmt of soybeans they pledged to purchase last fall. US weather remains bearish as rains thru the upcoming Holiday weekend are forecast to be heaviest for E. TX and the Gulf coast region stretching NE across the S. Midwest and ECB. Lighter amounts for the Great Lakes region and N. plains. Week 2 of the outlook continues to lean toward above normal temperatures and normal to above normal precipitation. Crush margins fell back $.03 to $3.51 ½ bu. while bean oil PV increased to 53.2%. Plantings remain at a record pace at 67%, above the 63% pace from YA and 5-year Ave. of 53%. MI is the only state with a noticeable delay at 37% vs. 46% Ave. Emergence at 32% matching YA and above the 5-year Ave. of 23%. While the fact sheet on Sunday maintains $17 bil. in additional agricultural purchases is on top of the 25 mmt China agreed to last fall, there has likely been some skepticism creeping into the marketplace as China has yet to make any new crop purchases. For that to start happening, however, I do think we’re going to need to see the price gap between the US and SA narrow a bit. US FOB offers at the Gulf remain more than $1 bu. above Argentina through the summer months. US FOB offers range from $.60-$.90 above that from Brazil. Recall last year it wasn’t until November before China booked their first shipments of US soybeans on the way to importing 12 mmt. For that volume to double in 26/27, they will likely have to start much sooner. EU 25/26 bean imports as of May 17th at 11.6 mmt are down 8% YOY. Meal imports at 15.7 mmt are down 7%.
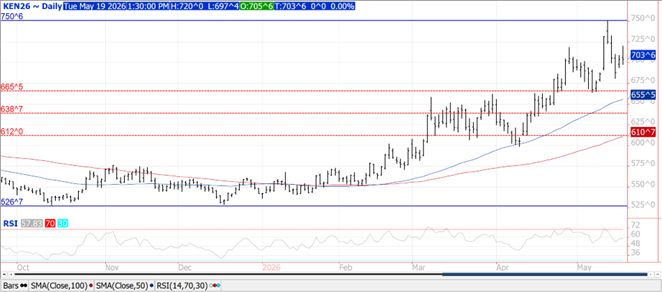
WHEAT
Prices ranged from down $.07 in MIAX to $.03 higher in CGO. Winter wheat ratings dipped another 1% to 27% G/E. There was a 3% increase in the crop rated poor/VP, now up to 43%. Overall ratings are well below their historical average. Ratings in KS fell another 2% to only 15% G/E while 58% of their crop is rated poor/VP. Look for abandonment levels to continue rising. Ratings did increase 4% in Ohio and 3% in both Ok and Oregon. Ratings in Montana fell another 13% and are off 20% in the past 2 weeks. Nationally 71% of the crop is headed, vs. 62% YA and 5-year Ave. of 58%. Spring wheat plantings advanced 20% to 73% complete, still trailing the YA pace of 80% however above the 5-year Ave. of 66%. Emergence at 39% is just below YA at 42% and above the 5-year Ave. of 34%. EU soft wheat exports at 20.63 mmt are up 7.3% YOY. US wheat prices remain uncompetitive in the global marketplace making US demand into China unlikely under current dynamics.
Risk Warning: Investments in Equities, Contracts for Difference (CFDs) in any instrument, Futures, Options, Derivatives and Foreign Exchange can fluctuate in value. Investors should therefore be aware that they may not realise the initial amount invested and may incur additional liabilities. These investments may be subject to above average financial risk of loss. Investors should consider their financial circumstances, investment experience and if it is appropriate to invest. If necessary, seek independent financial advice.
ADM Investor Services International Limited, registered in England No. 2547805, is authorised and regulated by the Financial Conduct Authority [FRN 148474] and is a member of the London Stock Exchange. Registered office: 3rd Floor, The Minster Building, 21 Mincing Lane, London EC3R 7AG.
A subsidiary of Archer Daniels Midland Company.
© 2021 ADM Investor Services International Limited.
Futures and options trading involve significant risk of loss and may not be suitable for everyone. Therefore, carefully consider whether such trading is suitable for you in light of your financial condition. The information and comments contained herein is provided by ADMIS and in no way should be construed to be information provided by ADM. The author of this report did not have a financial interest in any of the contracts discussed in this report at the time the report was prepared. The information provided is designed to assist in your analysis and evaluation of the futures and options markets. However, any decisions you may make to buy, sell or hold a futures or options position on such research are entirely your own and not in any way deemed to be endorsed by or attributed to ADMIS. Copyright ADM Investor Services, Inc.
