Written Commentary
CORN
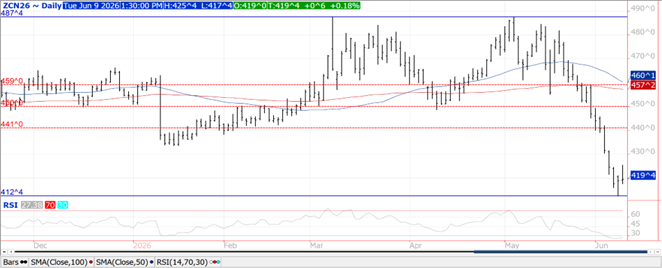
Prices were mixed and within a penny or unchanged in 2-sided trade. Spreads firmed with today being day 3 of the Goldman roll. Support for July-26 is at $4.05 with resistance at $4.41. The USDA announced a flash sale of 120k mt (4.7 mil. bu.) of old crop to an unknown buyer. Plantings advanced 4% to 97%, just above YA and the 5-year Ave. of 96%. Ratings held steady at 67% G/E, however there was a 2% shift from good to excellent. Overall ratings are slightly below their historical average. Emergence at 86% is in line with YA and the 5-year Ave. Traders expect little change in corn stocks (old and new crop) and 2026 production in Thursday’s USDA updates. I’ve got old crop ending stocks unchanged at 2.142 bil. with a 25 mil. bu. increase in exports offset by lower usage for ethanol. Census exports in April at 296 mil. bu. brought YTD shipments to 2.239 bil., up 24% YOY vs. the USDA forecast of up 15.5%. To reach the current USDA est. of 3.30 bil. bu. sales May through Aug need to reach 1.061 bil. vs. 1.049 bil. YA. EU corn imports as of June 7th at 16.9 mmt are down 10% YOY.
SOYBEANS
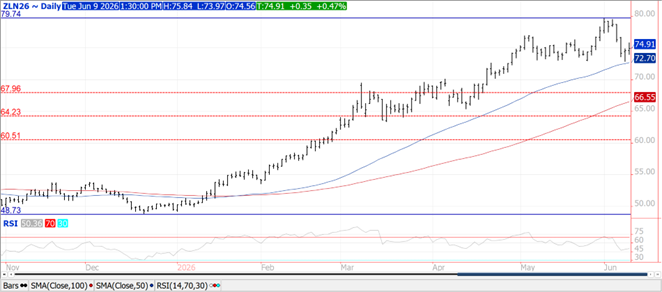
Mixed trade across the complex with beans down $.02-$.05, meal was $1 – $3 lower while oil ranged from 15 lower to 35 higher. Spreads firmed across the complex. July-26 meal closed into a fresh 4-month low. Speculative selling however has slowed this week after massive selling the previous 2 weeks. US weather remains mostly favorable however isolated areas of flooding are occuring in the central midwest. Even some areas of W. NE picked up some moisture bringing much needed drought relief. Crush margins rebounded $.02 to $3.72 ½ bu. while bean oil PV improved to 55.4%. After raising crush 20 mil. last month and lowering exports 10 mil. I’m looking for no changes this month with stocks holding near 340 mil. bu., in line with the average trade guess. No changes expected for 2026 production or stocks. Still on the lookout for fresh Chinese demand interest. Chinese bean imports in May-26 at 11.8 mmt were down 15% from the 13.92 mmt purchased in May-25 however were slightly above expectations. Their Jan-May imports at 36.94 mmt vs. 37.1 mmt YA. Soybean plantings at 92% are just above YA at 89% and 5-year Ave. of 88%. Emergence at 79% is well above YA at 73% and the 5-year Ave. of 71%. Ratings slipped 1% to 65% G/E as there was a 1% shift from good to poor. Expectations were for a slight increase in ratings. Overall conditions are slightly below their historical average. Census exports in April at 110 mil. bu. brought YTD shipments to 1.247 bil., down 23% YOY vs. the USDA forecast of down 19%. To reach the current USDA est. of 1.530 bil. bu. sales May through Aug need to reach 283 mil. vs. 262 bil. YA. EU soybean imports as of June 7th at 12.95 mmt are down 5% YOY. Meal imports at 17.65 mmt are off 3%.
WHEAT
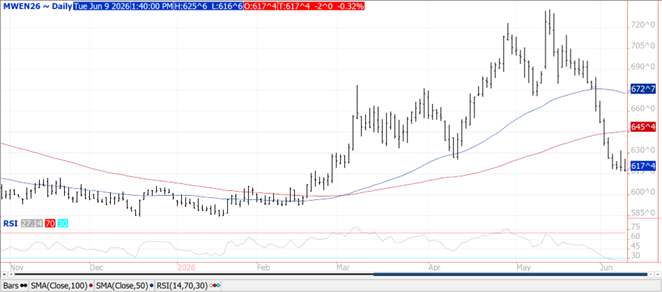
Prices ranged from $.02 lower in MIAX to $.02 higher in CGO. Too much rain across portions of the S. Midwest triggering the potential for disease and quality issues with the winter crop provided early support. I’ve got all wheat production at 1.553 bil. down 8 mil. from May, with the decline coming from WW which I have estimated at 1.040 bil., in line with trade expectations. I’ve got no changes to 25/26 stocks holding at 935 mil. with new crop stocks falling 8 mil. to 754 mil. Winter wheat ratings dipped another 1% to 25% G/E. There was a 2% increase in the crop rated poor/VP, now up to 46%. Overall ratings are the lowest of the crop cycle and the lowest in 20 years. Ratings in KS fell 1% to only 15% G/E. 57% of the crop in KS is rated poor/VP. My model is forecasting an Ave. US yield at 46.8 bpa, vs. the May-26 USDA forecast of 47.6 bpa. Harvest at 11% is above YA at 4% and the 5-year Ave. of 6%. Spring wheat emergence at 87% is above the historical average. 52% of the crop is rated G/E, up 5% from LW while trailing the 53% G/E from YA. Census exports in April at 69 mil. bu. brought YTD shipments to 835 mil., up 13% YOY vs. the USDA forecast of up 10%. To reach the current USDA est. of 910 mil. bu. sales in May will need to reach 75 mil. vs. 80 mil. YA. EU soft wheat exports at of June 7th at 22.05 mmt are up 7.4% YOY.
Risk Warning: Investments in Equities, Contracts for Difference (CFDs) in any instrument, Futures, Options, Derivatives and Foreign Exchange can fluctuate in value. Investors should therefore be aware that they may not realise the initial amount invested and may incur additional liabilities. These investments may be subject to above average financial risk of loss. Investors should consider their financial circumstances, investment experience and if it is appropriate to invest. If necessary, seek independent financial advice.
ADM Investor Services International Limited, registered in England No. 2547805, is authorised and regulated by the Financial Conduct Authority [FRN 148474] and is a member of the London Stock Exchange. Registered office: 3rd Floor, The Minster Building, 21 Mincing Lane, London EC3R 7AG.
A subsidiary of Archer Daniels Midland Company.
© 2021 ADM Investor Services International Limited.
Futures and options trading involve significant risk of loss and may not be suitable for everyone. Therefore, carefully consider whether such trading is suitable for you in light of your financial condition. The information and comments contained herein is provided by ADMIS and in no way should be construed to be information provided by ADM. The author of this report did not have a financial interest in any of the contracts discussed in this report at the time the report was prepared. The information provided is designed to assist in your analysis and evaluation of the futures and options markets. However, any decisions you may make to buy, sell or hold a futures or options position on such research are entirely your own and not in any way deemed to be endorsed by or attributed to ADMIS. Copyright ADM Investor Services, Inc.
