Written Commentary
CORN
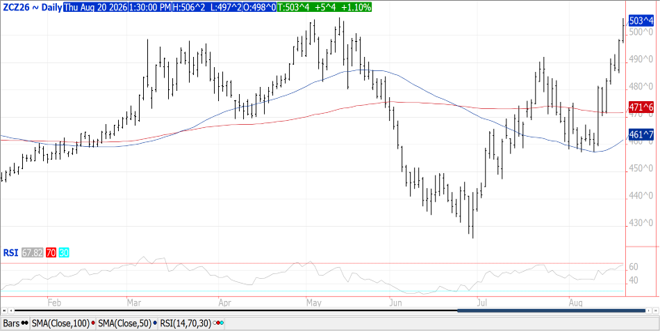
Prices were $.04-$.06 higher closing at about the midpoint of the days range. Spreads also firmed. Sept-26 and Dec-26 both stretched out to 3-month highs before pulling back. Dec-26 stopped just shy of its May high at $5.06 ½. The 3 districts in W. Iowa covered by the Pro Farmer crop tour yesterday, found yields 4-8 bu. below YA. 2 of those districts were very close to their 3-year Ave. with 1 district coming in 6 bpa above its 3-year Ave. In IL the tour projected yields at 184.2 bpa, well below the 199.6 bpa from YA and the 3-year Ave. of 199.2 bpa. Speculative traders bought 23k contracts yesterday, stretching their long position back out to nearly 260k, the largest in 3 months, probably closer to 275k after today. The speculative community is buying into the lower production, possibly higher demand narrative. US exports at 41 mil. bu. were in line with expectations. Old crop sales have reached 3.454 bil. bu. up 25% YOY vs. the USDA forecast of up 18%. Commitments represent 102% of the USDA forecast, above the historical average of 98%. Pace analysis would suggest the USDA export forecast at 3.400 is still 25-50 mil. bu. too low. New crop commitments have reached 448 mil. bu. falling behind YA by 32%. Noted buyers were Mexico and Japan, both taking 15 mil. bu. of old and new crop combined. US corn acres in drought fell 1% to 28%. Oddly enough history suggests final corn yields will be above the Aug-26 USDA est. of 180.7 bpa. Since 1990 the USDA lowered corn yields in August 16 times. In those years, final yields were above the August est. 11 times (69%), lower only 4 times while unchanged once.
SOYBEANS
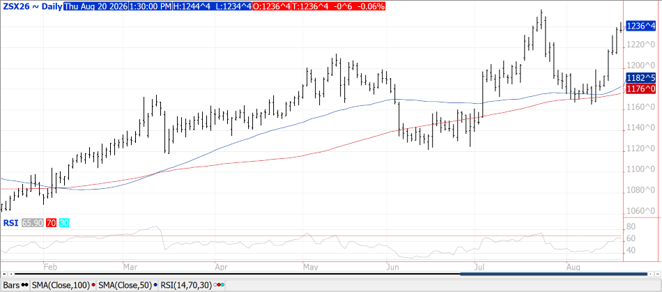
: Prices were mixed with beans holding within $.02 of unchanged, meal was $1-$3 lower while oil was up over $.01 per lb. Sept-26 and Nov-26 both trading up to new highs for the month before pulling back. Next resistance for Nov-26 is at its contract high of $12.56 ½. Sept-26 oil jumped as markets brace for reduced vegetable oils coming from the Black Sea. Crush margins bounced $.09 bu. to $2.57 with bean oil PV reaching 53%. US Gulf FOB offers continue to hold $.30-$.40 bu. below Brazilian offers thru the end of 2026. Hedgepoint Global Markets forecasts Brazil will harvest 181.7 mmt of soybeans in 2026/27, well below the USDA’s 186 mmt est. They expect harvested acres will increase marginally to 49.2 mil. HA, (121.6 mil. acres) up from 48.8 mil. HA last year. The US balance sheet has little wiggle room for yields to slip from the current USDA est. of 52.7 bpa or risk sharply tighter stocks. Pod count data from the 3 districts in Iowa covered by the Pro Farmer crop tour were all below YA, while 2 of the 3 were above their 3-year Ave. Pod count data in IL at 1,430 pods per 3×3 foot square were down from last year’s 1,479, however above their 3-year Ave. of 1,390. The tour will finish covering Iowa and MN today before meeting in Rochester, MN this afternoon ahead of releasing their final yield and production estimates. Bean exports at 66 mil. were in line with expectations. Old crop commitments at 1.539 bil. bu. are down 18% from YA vs. the USDA forecast of down 20%. Old crop shipments to China held at 12.36 mmt while new crop purchases of 1.131 mmt took YTD commitments to 5.69 mmt (208 mil. bu.). There are another 3.82 mmt (140 mil. bu.) to unknown. The USDA also announced a flash sale of 150k mt to unknown. New crop commitments jumped to 436 mil. bu., a 4-year high while up 102% YOY. Meal sales at 479k tons were at the high end of expectations. Old crop commitments are up 14% YOY vs. the revised USDA forecast of up 14.6% from YA. Oil commitments at 825 mil. lbs. are down 66% vs. the USDA forecast of down 61%.
WHEAT
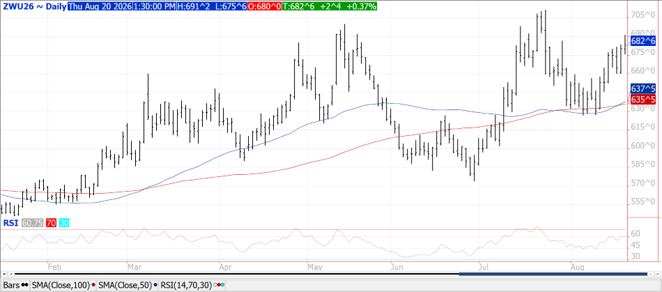
Prices ranged from steady to $.07 higher in 2-sided trade. CGO Sept-26 was up $.02 ½ at $6.82 ¾, KC Sept-26 was steady while MIAX Sept-26 was up $.06 ¾ to $7.00 ¾. Russia and Ukraine continue to target each other’s vessels and port infrastructure with missile/drone strikes. Despite Russia’s Aug-26 wheat shipments likely being the lowest in 16 years, their Ag. Ministry reports grain harvest is approaching 100 mil. tons as local fuel shortages are being resolved. The LSEG lowered their EU + UK wheat production forecast 2.3% to 145.5 mmt. The International Grains Council (IGC) lowered their 26/27 global production forecast 4 mmt to 817 mmt, now below the USDA forecast of 819.3. US exports at 14.5 mil. bu. were in line with expectations. YTD commitments at 289 mil. are down 32% from YA vs. the USDA forecast of down 15%. While pace analysis would suggest the USDA export forecast is too high, sales will likely accelerate if logistical delays from the Black Sea continue. US winter wheat areas in drought expanded 2% last week to 54% however durum acres in drought plunged 14% to 53%.
Risk Warning: Investments in Equities, Contracts for Difference (CFDs) in any instrument, Futures, Options, Derivatives and Foreign Exchange can fluctuate in value. Investors should therefore be aware that they may not realise the initial amount invested and may incur additional liabilities. These investments may be subject to above average financial risk of loss. Investors should consider their financial circumstances, investment experience and if it is appropriate to invest. If necessary, seek independent financial advice.
ADM Investor Services International Limited, registered in England No. 2547805, is authorised and regulated by the Financial Conduct Authority [FRN 148474] and is a member of the London Stock Exchange. Registered office: 3rd Floor, The Minster Building, 21 Mincing Lane, London EC3R 7AG.
A subsidiary of Archer Daniels Midland Company.
© 2021 ADM Investor Services International Limited.
Futures and options trading involve significant risk of loss and may not be suitable for everyone. Therefore, carefully consider whether such trading is suitable for you in light of your financial condition. The information and comments contained herein is provided by ADMIS and in no way should be construed to be information provided by ADM. The author of this report did not have a financial interest in any of the contracts discussed in this report at the time the report was prepared. The information provided is designed to assist in your analysis and evaluation of the futures and options markets. However, any decisions you may make to buy, sell or hold a futures or options position on such research are entirely your own and not in any way deemed to be endorsed by or attributed to ADMIS. Copyright ADM Investor Services, Inc.
