Mostly quiet end of the week for grain futures. Soybeans, soymeal, and soyoil finished slightly higher this week. Corn also traded slightly higher .Wheat futures also traded higher. US Dollar was higher. Crude and gold were lower.
SOYBEANS
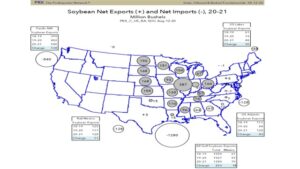
Soybean futures rallied from a low near 8.65 on August 10 to a high near 9.19 on Aug 19. Most of the rally was linked to short covering before USDA report and talk of increase China buying US soybeans. China has been a steady buyer of US soybeans. USDA announced today a total of 1.173 mmt of new new crop US soybean sales to China and unknown. Resistance was found due to talk of US farm yields being reported near USDA August guess and prospects of needed rains falling across US Midwest late next week. It will be dry until then. After the close, Pro Farmer estimated US 2020 soybean crop near 4,362 mil bu or a 52.5 yield. USDA August guess was a 4,425 and 53.3 yield. USDA estimates that US 2020/21 soybean exports will be 35 pct of total World trade. In 1964, US share was 78 pct. USDA estimates World 2020/21 soybean trade near a record 165 mmt. Normal end to US summer weather should pressure futures lower. USDA is estimating a 33 mmt increase in World 2020 soybean crop production, 22 from US and 8 from Brazil. Chart below shows Pro Exporters map of US cash soybean moment from the excess states to demand. Key to cash prices is demand and logistics it takes to move grain.
CORN
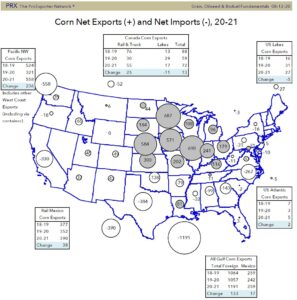
Corn futures traded higher. From a low near 3.20 on Aug 12 Dec corn traded up to near 3.46 on August 18. The market made new lows in front of what many thought would be a bearish USDA August crop report. The report was bearish but a bad windstorm flattened part of the record Iowa corn crop. Funds then covered their shorts given talk of big potential losses. This week’s Pro Farmer crop tour found corn yield near USDA August guess except for Nebraska and Iowa. After the close, Pro farmer estimated US 2020 corn crop near 14,820 mil bu or a 177.5 yield. USDA August guess was a 15,278 and 181.8 yield. In September USDA will resurvey farmers and also have a special survey for Iowa acres. Also in September USDA will use for the first time actual field data. USDA estimates that US 2020/21 corn exports will be 31 pct of total World trade. In 1979, US share was 84 pct. USDA is estimate World 2020/211 corn trade near a record 184 mmt. Normal end to US summer weather should pressure futures lower. USDA is estimating a 60 mmt increase in World 2020 corn crop production, 43 from US and 8 from Brazil. Chart below shows Pro Exporters map of US cash corn moment from the excess states to demand. Key to cash prices is demand and logistics it takes to move grain.


Charts provided by ProExporter Network
WHEAT
Wheat futures traded higher. For the third day in a row there has been buying on the close. Some feel this could be an importer (China) pricing Wheat they have bought. From a low near 4.97 on August 12 Dec Chicago wheat has rallied to today’s high near 5.35. From a low near 4.20 on August 7 Dec KC wheat has rallied to today’s high near 4.58. Some of the buying was due to higher French prices due to talk of Russian buying, Talk of China buying US HRW also helped prices. From a low near 5.06 on August 13 Dec Minn wheat has rallied to today’s high near 5.31. USDA August crop report was bearish wheat but USDA did not increase World Crop production as much as feared. Increase World importer buying may have also helped prices. USDA estimates that US 2020/21 wheat exports will be 14 pct of total World trade. In 1973, US share was 50 pct. USDA is estimating World 2020/21 wheat trade near a record 188 mmt. USDA is estimating a 2 mmt drop in World 2020 wheat crop production. Drop in EU cannot totally be offset by increase in Australia, Canada, Russia, China, India and Ukraine.
Risk Warning: Investments in Equities, Contracts for Difference (CFDs) in any instrument, Futures, Options, Derivatives and Foreign Exchange can fluctuate in value. Investors should therefore be aware that they may not realise the initial amount invested and may incur additional liabilities. These investments may be subject to above average financial risk of loss. Investors should consider their financial circumstances, investment experience and if it is appropriate to invest. If necessary, seek independent financial advice.
ADM Investor Services International Limited, registered in England No. 2547805, is authorised and regulated by the Financial Conduct Authority [FRN 148474] and is a member of the London Stock Exchange. Registered office: 3rd Floor, The Minster Building, 21 Mincing Lane, London EC3R 7AG.
A subsidiary of Archer Daniels Midland Company.
© 2021 ADM Investor Services International Limited.
Futures and options trading involve significant risk of loss and may not be suitable for everyone. Therefore, carefully consider whether such trading is suitable for you in light of your financial condition. The information and comments contained herein is provided by ADMIS and in no way should be construed to be information provided by ADM. The author of this report did not have a financial interest in any of the contracts discussed in this report at the time the report was prepared. The information provided is designed to assist in your analysis and evaluation of the futures and options markets. However, any decisions you may make to buy, sell or hold a futures or options position on such research are entirely your own and not in any way deemed to be endorsed by or attributed to ADMIS. Copyright ADM Investor Services, Inc.
