Written Commentary
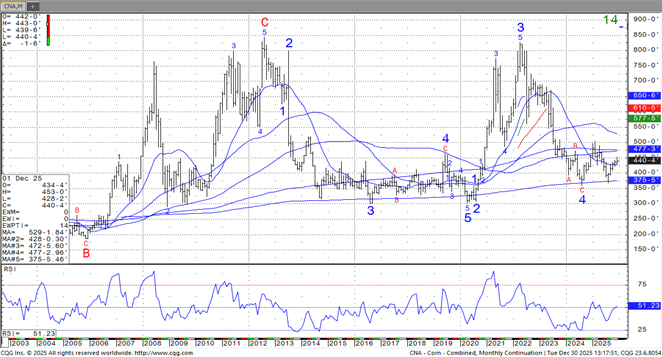
CORN
CH is near 4.40. This week, CH failed to push above resistance near 4.50 which triggered increase profit taking. Private estimates of US 25/26 corn carryout are near 2,320 mil bu vs USDA 2,029. Final US feed/residual is est closer to 5,925 mil bu vs USDA 6,100. Season to date exports are 1,066 mil bu vs 605 ly. Exports are est at 3,115 mil bu vs 2,858 last year. Ethanol use is est near 5,600 mil bu vs 5.436 ly. On the monthly chart, nearby corn futures had 4 peaks in 2008, 2011, 2012 and 2022 at or above 8.00. From 2014 to 2020 futures were near 3.00-3.50. Assuming normal 2026 global weather, Nearby corn futures should drop below 4.00.
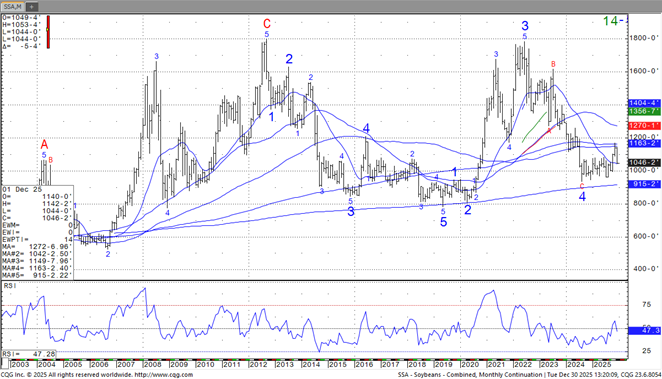
SOYBEANS
SH is near 10.61. This week, SH failed to push above resistance near 10.80 which triggered increase profit taking. Private estimates of US 25/26 soybean carryout is near 400 mil bu vs USDA 290. Season to date exports are 565 mil vs 1,053 ly. Final US exports are est closer to 1,500 vs USDA 1,635. US soybean crush could be a record 2,575 mil bu vs 2,445 ly. Trade will be watching South America weather. South half of Argentina is dry. No rain is forecast for next 10 days. Brazil will see normal rains. On the monthly chart, nearby soybean futures had 3 peaks in 2008, 20112 and 2022 near 17.00. From 2015-2020 nearby soybean futures were near a 8.00 low. Assuming normal 2026 global weather, Nearby soybean futures should drop below 10.00.

WHEAT
WH is near 5.11. This week, WH failed to push above resistance near 5.20 which triggered increase profit taking. KWH is near 5.22. MWZ is near 5.79.Trade est US 25/26 wheat carryout closer to 880 mil bu vs USDA 901 due to higher exports. Season to date exports are 553 mil bu vs 453 ly. Trade est US 2026 wheat acres at 44.0 mil vs 45.3 this past year. 26/27 carryout is estimate near 844 mil bu due to lower crop offset by lower exports. On the monthly chart, in 2025 nearby Chicago wheat futures had 2 peaks, 2008 and 2022 near 14.00. From 2006-2029 nearby Chicago futures were near 5.00. Assuming normal 2026 global weather, Nearby Chicago wheat futures should drop below 5.00.
Charts provided by CQG
Risk Warning: Investments in Equities, Contracts for Difference (CFDs) in any instrument, Futures, Options, Derivatives and Foreign Exchange can fluctuate in value. Investors should therefore be aware that they may not realise the initial amount invested and may incur additional liabilities. These investments may be subject to above average financial risk of loss. Investors should consider their financial circumstances, investment experience and if it is appropriate to invest. If necessary, seek independent financial advice.
ADM Investor Services International Limited, registered in England No. 2547805, is authorised and regulated by the Financial Conduct Authority [FRN 148474] and is a member of the London Stock Exchange. Registered office: 3rd Floor, The Minster Building, 21 Mincing Lane, London EC3R 7AG.
A subsidiary of Archer Daniels Midland Company.
© 2021 ADM Investor Services International Limited.
Futures and options trading involve significant risk of loss and may not be suitable for everyone. Therefore, carefully consider whether such trading is suitable for you in light of your financial condition. The information and comments contained herein is provided by ADMIS and in no way should be construed to be information provided by ADM. The author of this report did not have a financial interest in any of the contracts discussed in this report at the time the report was prepared. The information provided is designed to assist in your analysis and evaluation of the futures and options markets. However, any decisions you may make to buy, sell or hold a futures or options position on such research are entirely your own and not in any way deemed to be endorsed by or attributed to ADMIS. Copyright ADM Investor Services, Inc.
