Written Commentary
CORN
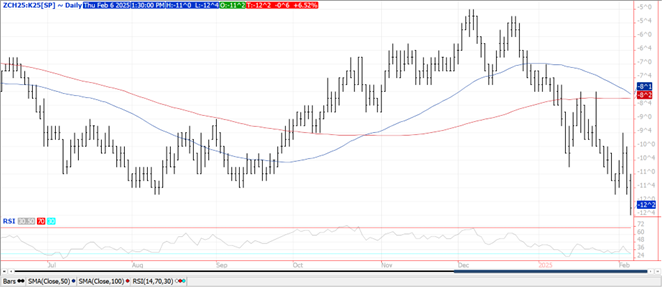
Prices closed $.01-$.03 higher, snapping back from early losses. Nearby spreads weakened while back months firmed. Mch/May established a new low at $.12 1/2 ahead of the Goldman roll that starts tomorrow and goes thru next Thurs. Index funds are holding their largest position in corn in nearly 3 years at just over 470k contracts. Chicago wheats premium to corn has rebounded $.40 from last month’s low. The most recent CFTC report showed a record divergence of speculative holdings in wheat and corn, short nearly 111k in Chicago wheat and long just over 350k corn. Export sales at 58 mil. bu. were at the high end of expectations. YTD commitments at 1.762 bil. up 28% from YA, vs. the USDA forecast of up 7%. Current commitments represent 72% of the USDA forecast, above the historical average of 65%. Noted buyers were Mexico – 17 mil. while Japan and S. Korea bought 8-9 mil. each. US corn acres in drought rose 4% this week to 46%, well above the 27% YA. The BAGE report Argentine corn ratings fell 3% to 25% G/E while 26% of the crop is rated poor, up 4% from LW.
SOYBEANS
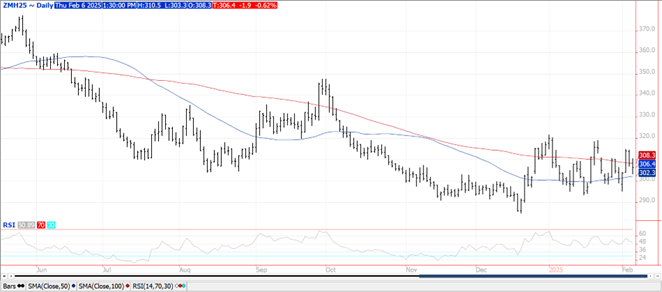
Prices were mixed with beans $.03-$.04 higher, meal was down $2 despite strong exports while oil was 30-40 points higher. Bean and meal spreads were little changed while nearby oil spreads made new lows. Mch-25 soybeans closed near the midpoint of this week’s range. Support for Mch-25 meal is at its 50 day MA at $302.30. Mch-25 oil continues to chop around $.45 lb. Spot board crush margins slipped $.04 ½ to $1.13 bu. while bean oil PV recovered to 42.6%. No major tariff headlines however China indicated they would protect their interests from US bullying by filing a complaint with the WTO. Heavy rains yesterday across dry areas of EC Argentina will help stabilize crop readings in this region. Scattered showers in RGDS in southern Brazil brought some relief from recent hot/dry conditions. Shower activity across the EC and CS region will begin to lighten up in intensity and coverage allowing better opportunities for soybean harvest and corn plantings. Bean exports at 14 mil. bu. were at the low end of expectations. YTD commitments at 1.582 bil. are up 12% from YA vs. the USDA forecast of up 8%. Commitments represent 87% of the USDA forecast, above the historical average of 84%. China/unknown had net cancellations of 2 mil. bu. reducing outstanding sales to 210 mil. vs. 246 YA and 276 in 2023. Soybean meal sales at 531k tons were above expectations. YTD commitments are up 13.5% from YA, vs. USDA up 8%. Soybean oil sales at 2k mt (5 mil. lbs.) were in line with expectations. YTD commitments at 1.486 bil. lbs. represent 93% of the USDA forecast of 1.60 bil. Oil sales have cooled as the record discount to palm oil has narrowed significantly in recent weeks. US soybean acres in drought expanded 2% this week to 37% compared to 27% YA. The BAGE report soybean ratings fell 3% to 17% G/E while 32% of the crop is rated poor, up 4% from LW.
WHEAT
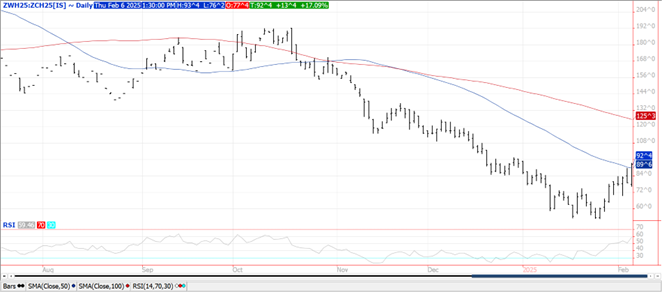
Prices surged across all 3 classes with Chicago and KC up $.13-$.16 while MGEX was $.10 higher. An outside day higher for both Chicago and KC Mch-25 contracts. A fresh 3 month high for Mch-25 Chicago with next resistance at $6.00. Longer term resistance at $6.20, a 38% retracement from the high last May to the Jan-25 low. Mch-25 KC close above the $6.00 level for the 1st time in 3 ½ months. Much cooler temperatures are expected across the Black Sea region in week 2 of the outlook increasing the odds of winterkill as little snow cover currently exists. Similar outlook for the US southern plains. A suspect much of today’s strength is driven by speculative short covering as they reconsider their ability to profit staying short wheat. Exports at 18 mil. bu. (16 mil. – 2024/25 MY, 2 mil. – 25/26) were in line with expectations as old crop commitments have reached 683 mil. bu. up 8% from YA, vs. the USDA forecast of up 20%. Commitments represent 80% of the USDA forecast vs. the historical average of 83%. US WW acres drought slipped 1% to 23% vs. only 14% YA while spring wheat acres in drought held steady at 45%. Heaviest concentration of drought remains in the NW corn belt and northern plains. Stats Canada tomorrow is expected to show all wheat stocks at the end of 2024 at 23 mmt, up from 20.68 mmt at the end of 2023.
Charts provided by QST.
>>See more market commentary here.
Risk Warning: Investments in Equities, Contracts for Difference (CFDs) in any instrument, Futures, Options, Derivatives and Foreign Exchange can fluctuate in value. Investors should therefore be aware that they may not realise the initial amount invested and may incur additional liabilities. These investments may be subject to above average financial risk of loss. Investors should consider their financial circumstances, investment experience and if it is appropriate to invest. If necessary, seek independent financial advice.
ADM Investor Services International Limited, registered in England No. 2547805, is authorised and regulated by the Financial Conduct Authority [FRN 148474] and is a member of the London Stock Exchange. Registered office: 3rd Floor, The Minster Building, 21 Mincing Lane, London EC3R 7AG.
A subsidiary of Archer Daniels Midland Company.
© 2021 ADM Investor Services International Limited.
Futures and options trading involve significant risk of loss and may not be suitable for everyone. Therefore, carefully consider whether such trading is suitable for you in light of your financial condition. The information and comments contained herein is provided by ADMIS and in no way should be construed to be information provided by ADM. The author of this report did not have a financial interest in any of the contracts discussed in this report at the time the report was prepared. The information provided is designed to assist in your analysis and evaluation of the futures and options markets. However, any decisions you may make to buy, sell or hold a futures or options position on such research are entirely your own and not in any way deemed to be endorsed by or attributed to ADMIS. Copyright ADM Investor Services, Inc.
