SOYBEANS
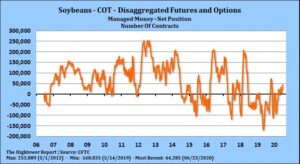
This week soybean futures jumped 40 cents and are near 9.00. Shocking USDA estimate of US soybean and corn acres below the average trade guess sparked a rally that was supported by increase fund buying. Open interest increased suggesting new longs. The rally was met with increase US farmer selling. Managed funds are net short 46,000 soymeal and long 53,000 soybeans. Key now is US weather. Yesterday’s 2 week weather maps had a ridge over the central US Midwest. Overnight, the maps moved the ridge next week west. This morning, the maps have the ridge in the SW. Rains move over the top of the ridge and in the north plains, in the great lakes and SE. 10 day NE, IA, IL and IN rainfall could be less than normal. Weekly US soybean export sale were only 9 mil bu. Total commit is near 1,655 mil bu versus 1,778 last year. USDA goal is 1,775 versus 2,065 last year. Key is China buying. New crop corn sales rose 30 mil bu. USDA did announce 126 mt US new crop soybean sales to China. US open new crop sales are only 254 mil bu.

CORN
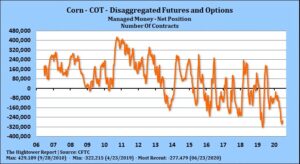
Corn futures rallied almost 40 cents this week after USDA estimated US 2020 corn acres below the average traded guess. Open interest dropped on the rally suggesting fund short covering. The rally was met with massive US farmer selling. Key now is US summer weather. Today corn futures gave back some of the gains due to weak weekly US export sales and uncertainty over US 2 week weather. Managed funds are net short 203,000 corn contracts. Key now is US weather. Yesterday’s 2 week weather maps had a ridge over the central US Midwest. Overnight, the maps moved the ridge next week west. This morning, the maps have the ridge in the SW. Maps will change 2 times per day over the next 3 days. This suggest increase volatility and risk for Monday. Weekly US corn export sale were only 14 mil bu. Total commit is near 1,665 mil bu versus 1,925 last year. USDA goal is 1,650 versus 1,748 last year. New crop corn sales rose only 10 mil bu. US corn export prices are the highest in the World. USDA did announce 202 mt US new crop corn sales to China. US open new crop sales are only 153 mil bu. On July 10 USDA will issue ne US supply and demand tables. For corn they should lower acres and feed use. Historically. They have raised and lowered the corn yield depending upon weather. They could raise the yield this time. This week’s CFTC commit of traders report will be delayed until Monday due to the US Holiday.

WHEAT
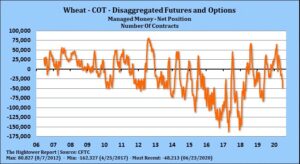
Wheat futures ended lower. WU rallied 30 cents this week only to give part of it back today. KWU rallied 25 cents this week but also traded lower today. MWU rallied 20 cents this week back gave most of it back. Increase global north hemisphere harvest and talk of reduced import demand continues to weigh on futures. Managed funds were sellers of 6,000 wheat. Managed funds are net short 41,000 wheat. Open interest went up in wheat. This could suggest new shorts in wheat. Weekly US wheat export sale were 15 mil bu. Total commit is near 267 mil bu vs 264 last year. USDA goal is 950 versus 965 last year. US HRW export prices are $15 dollars above Russia. Slow start to World wheat traded could limit the upside in prices. Food and Ag Commodity Economics group, formally known as Informa estimated US 2020 Wheat crop near 1,856 mil bu versus USDA 1,877 and 1,920 last year. HRW is 716 versus 833 last year. SRW 291 versus 239 and HRS 562 versus 562 ly FACE also estimated Russia wheat near 78 mmt versus 73 previous. US 2020 wheat crop was down 1 mmt to 50 mmt versus 52 last year.

Risk Warning: Investments in Equities, Contracts for Difference (CFDs) in any instrument, Futures, Options, Derivatives and Foreign Exchange can fluctuate in value. Investors should therefore be aware that they may not realise the initial amount invested and may incur additional liabilities. These investments may be subject to above average financial risk of loss. Investors should consider their financial circumstances, investment experience and if it is appropriate to invest. If necessary, seek independent financial advice.
ADM Investor Services International Limited, registered in England No. 2547805, is authorised and regulated by the Financial Conduct Authority [FRN 148474] and is a member of the London Stock Exchange. Registered office: 3rd Floor, The Minster Building, 21 Mincing Lane, London EC3R 7AG.
A subsidiary of Archer Daniels Midland Company.
© 2021 ADM Investor Services International Limited.
Futures and options trading involve significant risk of loss and may not be suitable for everyone. Therefore, carefully consider whether such trading is suitable for you in light of your financial condition. The information and comments contained herein is provided by ADMIS and in no way should be construed to be information provided by ADM. The author of this report did not have a financial interest in any of the contracts discussed in this report at the time the report was prepared. The information provided is designed to assist in your analysis and evaluation of the futures and options markets. However, any decisions you may make to buy, sell or hold a futures or options position on such research are entirely your own and not in any way deemed to be endorsed by or attributed to ADMIS. Copyright ADM Investor Services, Inc.
