Written Commentary
CORN
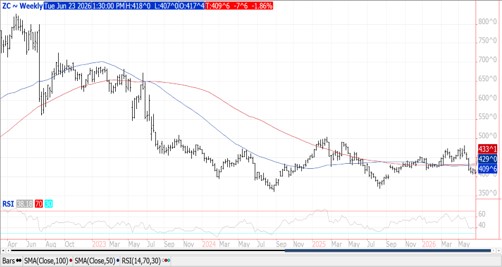
Prices closed $.02 lower after holding support above last week’s contract lows. Spreads were mixed and little changed. Support for July-26 rests at $4.05, a gap on the weekly chart from Sept-25. The USDA did report a flash sale of 100k mt (4 mil. bu.) to Mexico. The MM short position in corn at 46k contracts is the largest in 4 months. US crop ratings held steady at 68% G/E, in line with expectations. Ratings improved in 11 states while declining in 7. Overall conditions remain slightly above their historical average. Ratings jumped 9% in IN, 7% in TN and 6% in TX. Ratings fell 7% in OH and 6% in IL. 5% of the crop is silking vs. 4% YA and the 5-year Ave. of 3%. Updated cost of production estimates from the USDA continue to show US farmers will likely operate in the red for their 2026 crops. The per acre revenue estimates use the USDA Ave. Farm Price est. times the current Ave. trendline yield forecast of 183 bpa. EU corn imports as of June 21st at 17.8 mmt are down 8% YOY. Upside price potential would appear limited unless demand interest from China shows up soon or if hot/dry conditions stretch into mid-July. Otherwise look for July-26 to rechallenge $4.05.
SOYBEANS
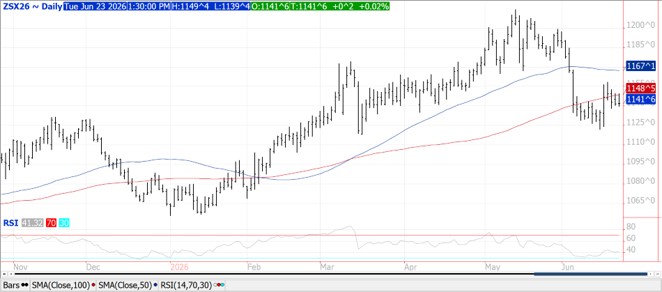
Prices were mixed as beans ranged from $.01 ½ higher to a penny lower, meal ranged from $2 lower to $3 higher while oil was down 30-55 points. Early weakness saw nearby bean spreads trade to new lows before closing mixed. Meal spreads firmed while oil spreads weakened. Nov-26 beans have been consolidating around its 100-day MA the past few sessions, currently at $11.48 ½. Crush margins were little changed holding near $3.26 bu. while bean oil PV slipped to 53.8%. Prices will continue to be sensitive to Chinese demand, or the lack thereof. US FOB offers at the Gulf are back to $.15-$.25 premium over Brazilian offers for July/Aug-26, while slightly below Sept-26 forward. MM’s have been net sellers across the soybean complex for the past 4 weeks, during which time they sold just over 301k contracts, the most ever over a 4-week period. Crop ratings held at 66% G/E, in line with expectations. There was a 1% shift from good to excellent enabling the CC index to improve to 81.9, slightly above the historical average while the highest in 6 years. Ratings improved in only 7 states, while declining in 11. Ratings rose 16% in TN, 11% in MS and 9% in IN. Ratings declined 8% in MS and 6% in LA. Emergence at 93% is just above YA and the 5-year Ave. 9% of the crop is blooming, vs. 7% YA and 5-year Ave. of 6%. EU soybean imports as of June 21st at 13.7 mmt are down 4% YOY. Meal imports at 18.47 mmt are down 2.6%. US soybean farmers are also forecast to operate in the red, however slightly better than in the past 2 years.
WHEAT
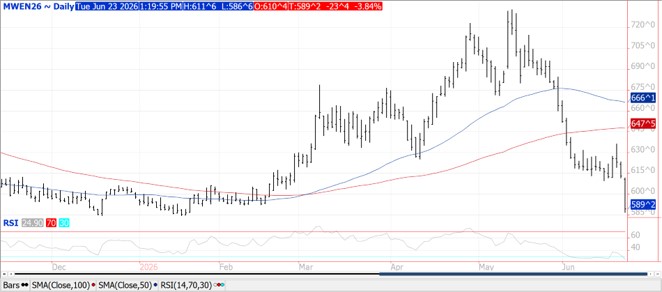
The weakling in the Ag. space today as prices collapsed $.11-$.23. CGO July-26 was down $.10 ¾ at $5.86 ¾ while KC July-26 was $.15 ¼ lower at $6.18 1/4. MIAX July-26 is down $.23 ½ at $5.89 ¼ as forecasts for rain in the N. plains drove prices to a 4-month low. Winter wheat ratings slipped 1% to 26% G/E. Overall ratings remain the lowest in 20 years for mid-June. Harvest advanced more than expected to 40%, vs. 18% YA and 5-year Ave. of 24%. With harvest advancing rapidly I suspect we will see an even higher level of abandoned acres than the current USDA est. My model is forecasting an Ave. yield of 46.95 bpa vs. USDA at 46.8. Spring wheat ratings slipped 1% to 54% G/E matching YA. Ratings improved in 2 states while falling in 4. Argus raised their Ukraine 26/27 production forecast .6 mmt to 24.1 mmt citing better than expected yields in the SE regions. Meanwhile SovEcon lowered their 2026/27 Russian production forecast 1.4 mmt to 88.9 mmt citing lower spring wheat acres. Total acres at 25.8 mil. HA are the lowest in 12 years. The SovEcon production forecast is still above the USDA est. of 88 mmt. EU soft wheat exports at 22.73 mmt are up 7% YOY.
Risk Warning: Investments in Equities, Contracts for Difference (CFDs) in any instrument, Futures, Options, Derivatives and Foreign Exchange can fluctuate in value. Investors should therefore be aware that they may not realise the initial amount invested and may incur additional liabilities. These investments may be subject to above average financial risk of loss. Investors should consider their financial circumstances, investment experience and if it is appropriate to invest. If necessary, seek independent financial advice.
ADM Investor Services International Limited, registered in England No. 2547805, is authorised and regulated by the Financial Conduct Authority [FRN 148474] and is a member of the London Stock Exchange. Registered office: 3rd Floor, The Minster Building, 21 Mincing Lane, London EC3R 7AG.
A subsidiary of Archer Daniels Midland Company.
© 2021 ADM Investor Services International Limited.
Futures and options trading involve significant risk of loss and may not be suitable for everyone. Therefore, carefully consider whether such trading is suitable for you in light of your financial condition. The information and comments contained herein is provided by ADMIS and in no way should be construed to be information provided by ADM. The author of this report did not have a financial interest in any of the contracts discussed in this report at the time the report was prepared. The information provided is designed to assist in your analysis and evaluation of the futures and options markets. However, any decisions you may make to buy, sell or hold a futures or options position on such research are entirely your own and not in any way deemed to be endorsed by or attributed to ADMIS. Copyright ADM Investor Services, Inc.
