Written Commentary
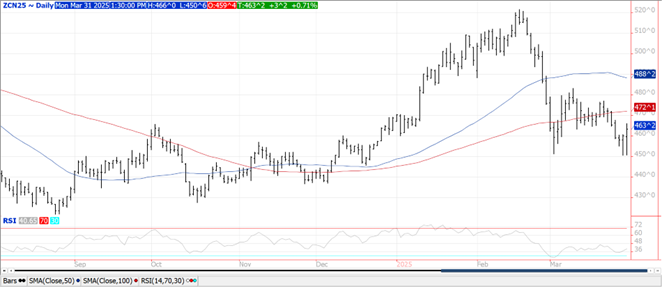
CORN
Prices ranged from up $.04 in old crop while new crop was fractionally lower. July-25 continues to hold support above $4.50. Next major resistance is the 100 day MA at $4.72. Mch. 1st stocks at 8.150 bil. bu. was in line with expectations however down 202 mil. from YA. The stocks figure divided by the first 6 months usage at 96% is down from 100% YA and in line with the historical average. Planting intentions at 95.326 mil. acres were nearly 1 mil. above expectations and up 4.732 mil. from YA. If realized this would be the most corn acres in 12 years. Increases to key production states were: IA +600k acres, NE +550k, MN and SD +400k, TX and IL +300k. Export inspections at 63.5 mil. bu. were above expectations and above the 46 mil. bu. needed per week to reach the USDA forecast of 2.450 bil. bu. YTD inspections at 1.337 bil. up 31% from YA vs. the USDA forecast of up 7%. Largest takers were Mexico – 14.5 mil., Japan – 11 mil. Colombia – 9 mil. and S. Korea with 8 mil. Still lean towards a higher export figure in the April-25 WASDE. Last week MM’s sold nearly 33k contracts of corn reducing their long position to 74,607 contracts, their smallest position since Nov-24. MM’s and index funds have both been net sellers of corn the past 5 weeks.
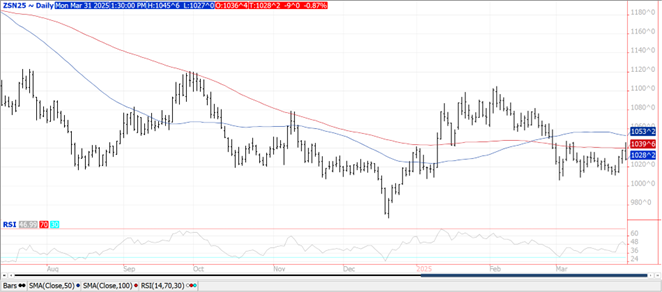
SOYBEANS
Prices were lower across the complex with beans $.08-$.10 lower, meal was down $1-$2 while oil was down 25-30 points. Spreads were mixed in beans and oil however firmed up in meal. July-25 beans rejected trade above its 100 day MA at $10.39 ¾. July-25 oil traded to a fresh high for the month however failed to trade over $.46 lbs. July-25 meal closed below $300/ton for the 1st time in 3 ½ months. Mch. 1st stocks at 1.910 bil. bu. roughly 10 mil. above expectations and up 65 mil. from YA. The stocks figure divided by the first 6 months usage at 68% is down from 71% YA and also in line with the historical average. Planting intentions at 83.495 mil. was roughly 260k below expectations and down 3.56 mil. from YA. If realized would be the lowest planted acres in 5 year. Reductions to key states as follows: IA -450k acres, ND & MN -400k acres, SD – 350k, NE & IL -300k. Soybean inspections at 29 mil. bu. were at the high end of expectations and well above the 7 mil. needed per week to reach the USDA forecast of 1.825 bil. bu. YTD inspections at 1.497 bil. are up 10% from YA vs. USDA forecast of up 8%. China took nearly 23 mil. Last week MM’s were net sellers of 23k contracts of soybean meal, 21k soybeans and 17k soybean oil extending their short positions across the entire complex. Combined production of bio and renewable diesel plunged 23% in Jan-25 to 339 mil. gallons and was down 13% YOY. Soybean oil usage plunged 40% to only 654 mil. lbs., the lowest monthly figure in 5 years. Census crush from Feb-25 out tomorrow is expected to show soybean crushers processed 189 mil. bu. of beans which would be off 2.5% from YA. Despite the lower production bean oil stocks are expected to surge 5.6% to 2.268 bil. lbs.
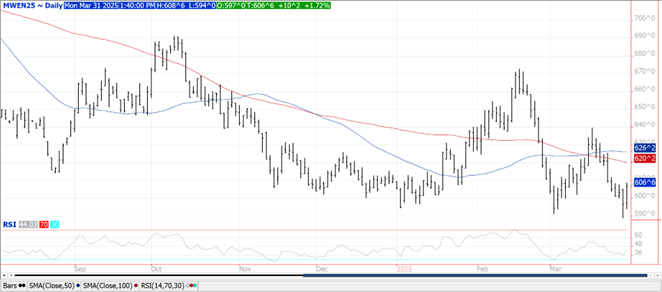
WHEAT
Prices were up $.05-$.11 today as the market adjust to fewer US acres. MGEX futures was the leader to the upside, perhaps in a bid to attract more acres this spring. In the US widespread rains for the central and ECB this week. Heavy accumulation of 8+” for areas of the southern Midwest into the Ohio Valley region will likely produce flooding and planting delays. Some replant may also be necessary. Dry areas in the SW plains have the potential for healthy rains towards the end of the 7 day outlook which would provide much needed relief for winter wheat growing areas. Mch 1st stocks at 1.237 bil. were roughly 20 mil. above expectations, up 148 mil. from YA. Stocks divided by usage over the first 9 months of the MY at 80%, up from 78% YA and just above the historical average. All wheat acres at 45.35 mil. were 1.13 mil. below expectations, down 729k from YA. If realized would be the 2nd lowest ever in the US. Winter wheat acres at 33.315 mil. were down nearly 800k from Jan-25. Spring wheat acres at 10 mil. were at the low end of expectations, and down 623k from YA. Export inspections at 16 mil. bu. in line with expectations however below the 21 mil. needed per week to reach the revised USDA forecast. YTD inspections at 635 mil. up 16% from YA, vs. the USDA forecast of up 18%. Last week MM’s sold nearly 12k contracts of CGO wheat and just over 1,100 MGEX while buying just over 1,200 KC futures.
Charts provided by QST.
>>See more market commentary here.
Risk Warning: Investments in Equities, Contracts for Difference (CFDs) in any instrument, Futures, Options, Derivatives and Foreign Exchange can fluctuate in value. Investors should therefore be aware that they may not realise the initial amount invested and may incur additional liabilities. These investments may be subject to above average financial risk of loss. Investors should consider their financial circumstances, investment experience and if it is appropriate to invest. If necessary, seek independent financial advice.
ADM Investor Services International Limited, registered in England No. 2547805, is authorised and regulated by the Financial Conduct Authority [FRN 148474] and is a member of the London Stock Exchange. Registered office: 3rd Floor, The Minster Building, 21 Mincing Lane, London EC3R 7AG.
A subsidiary of Archer Daniels Midland Company.
© 2021 ADM Investor Services International Limited.
Futures and options trading involve significant risk of loss and may not be suitable for everyone. Therefore, carefully consider whether such trading is suitable for you in light of your financial condition. The information and comments contained herein is provided by ADMIS and in no way should be construed to be information provided by ADM. The author of this report did not have a financial interest in any of the contracts discussed in this report at the time the report was prepared. The information provided is designed to assist in your analysis and evaluation of the futures and options markets. However, any decisions you may make to buy, sell or hold a futures or options position on such research are entirely your own and not in any way deemed to be endorsed by or attributed to ADMIS. Copyright ADM Investor Services, Inc.
