Written Commentary
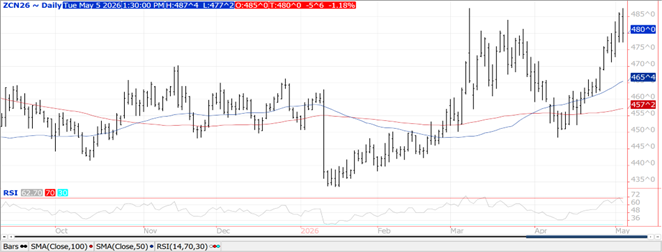
CORN
Prices were $.04-$.06 lower in 2-sided trade. Spreads were weaker. July-26 matched its March high at $4.87 ½ before turning lower. Dec-26 jumped out to a fresh 2 ½ year high before backing up. Both July and Dec. held at or above yesterday’s low. Plantings advanced 13% to 38% matching the YA pace and just ahead of the 5-year Ave. of 34%. The Northern Midwest remains the only region lagging their historical average. Emergence at 13% is above the YA pace of 10% and the 5-year Ave. of 9%. Huge speculative buying yesterday likely took the MM long position up to nearly 300k contracts. O.I. surged 37k contracts. Mch-26 census exports at 316 mil. bu. was up 19% from Feb-26 and up 9% YOY. Shipments were 10 mil. above the implied inspections. YTD exports at 1.943 bil. are up 30% from YA, vs. the USDA forecast of up 15.5%.
SOYBEANS
Prices are mixed with beans down $.07-$.12, meal was steady to $2 lower while oil was 35-40 higher. Bean spreads weakened while product spreads were mixed. Despite the pullback, both July-26 and Nov-26 held within yesterday’s range. July-26 meal continues to consolidate near its 50-day MA. Next resistance for spot oil is the Nov-22 high at 78.64. Spot board crush margins surge $.20 to a new modern-day record at $3.76 ½ bu. while bean oil PV held at its all-time high at 54.9%. With D4 RIN’s valued at just over $2, S&P Global calculates RD breakeven price for soybean oil at nearly $.90 lb., still below current price levels. The MM record long position in bean oil likely surpassed 200k contracts in today’s trade. Energy prices were lower in 2-sided trade as markets monitor developments in the Middle East. While the US/Iran ceasefire remains fragile, US Defense Sec. Hegseth maintains the ceasefire “certainly holds” while the lane through the Straits of Hormuz is clear. Plantings remain at a record pace at 33%, above the 28% pace from YA and 5-year Ave. of 23%. Rain this week in the Delta region will slow the remaining plantings. As of Sunday, MS has reached 77% vs. 57% Ave., LA at 84% vs. 58% Ave. and AR at 73% vs. 47% Ave. Emergence has reached 13% vs. only 6% YA and 5-year Ave. of 5%. In advance of the Trump/Xi summit in Beijing in just over a week, Treasury Sec. Bessent yesterday urged China to persuade Iran to open the Strait of Hormuz. Mch-26 census exports at 145 mil. bu. were down 6% from Feb-26 however up 13% YOY. Cumulative exports at 1.137 bil. are down 26% YOY, vs. the USDA forecast of down 18%. To reach the current USDA export forecast of 1.540 bil. bu. sales will need to reach 403 mil. April through August, vs. 342 mil. YA. EU bean imports for the 25/26 MY as of May 3rd at 11.1 mmt are down 8%. Meal imports at 14.96 mmt are down 6.5%.
WHEAT
Prices recovered late in both KC and MIAX finishing $.03-$.05 lower while CGO was down $11-$.13. CGO July-26 was down $.13 ¼ at $6.27 ¾, KC July-26 was $.04 ½ lower at $6.90 while MIAX July-26 was down $.03 at $6.96. Winter wheat ratings increased 1% to 31% G/E, however there was a 2% increase in Poor/VP to 37%. Overall ratings remain below their historical average and the lowest in 3 years. Ratings in KS fell another 1% to only 22% G/E while poor/VP held rose 3% to 44%. I’d expect a higher-than-normal level of abandonment in KS this year. Ratings fell 8% in WA and 6% in NE. Conditions jumped 8% in IL and MO. Nationally 49% of the crop is headed, vs. 37% YA and 5-year Ave. of 32%. In KS 70% of the crop was headed. Current conditions suggest WW production at 1.187 bil. bu. with an average yield of 49.6 bpa. Spring wheat plantings at 32% trail the YA pace of 42% and 5-year Ave. of 35%. Mch-26 census exports at 67 mil. bu. were down 6% from Feb-26 however up 1% YOY. YTD sales at 766 mil. bu. is up 16.7% YOY, vs. the USDA forecast of up 9%.
Risk Warning: Investments in Equities, Contracts for Difference (CFDs) in any instrument, Futures, Options, Derivatives and Foreign Exchange can fluctuate in value. Investors should therefore be aware that they may not realise the initial amount invested and may incur additional liabilities. These investments may be subject to above average financial risk of loss. Investors should consider their financial circumstances, investment experience and if it is appropriate to invest. If necessary, seek independent financial advice.
ADM Investor Services International Limited, registered in England No. 2547805, is authorised and regulated by the Financial Conduct Authority [FRN 148474] and is a member of the London Stock Exchange. Registered office: 3rd Floor, The Minster Building, 21 Mincing Lane, London EC3R 7AG.
A subsidiary of Archer Daniels Midland Company.
© 2021 ADM Investor Services International Limited.
Futures and options trading involve significant risk of loss and may not be suitable for everyone. Therefore, carefully consider whether such trading is suitable for you in light of your financial condition. The information and comments contained herein is provided by ADMIS and in no way should be construed to be information provided by ADM. The author of this report did not have a financial interest in any of the contracts discussed in this report at the time the report was prepared. The information provided is designed to assist in your analysis and evaluation of the futures and options markets. However, any decisions you may make to buy, sell or hold a futures or options position on such research are entirely your own and not in any way deemed to be endorsed by or attributed to ADMIS. Copyright ADM Investor Services, Inc.
