Written Commentary
CORN
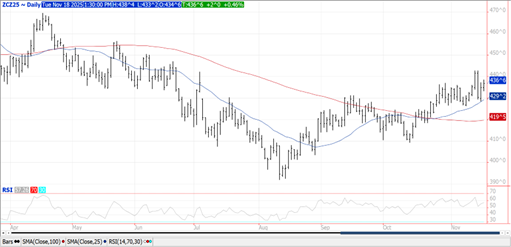
Prices were $.01-$.02 higher in 2 sided trade. Spreads also firmed. Dec-25 pushed above yesterday’s high with next resistance at LW’s high of $4.42 ¾. The Dec/July spread at one point narrowed to $.24 ¼, the highest in 7 months. Updated harvest progress showed only 91% of the US crop has been harvested as of Sunday the 16th, below the 98% pace from YA and the 5-year Ave. of 94%. Delays are most prominent in the WCB with NE at only 74% vs. 5-year Ave. of 95%, KS at 92% vs. 97% Ave., and SD at 90% vs. 94% Ave. With rains in NE limited to the far southern region should enable good harvest progress this week. Chinese corn imports in Oct-25 at 430k mt were up 43% YOY, however YTD imports at only 1.29 mmt are off 90%. EU 25/26 corn imports as of Nov. 16th at 6.02 mmt are down 23% YOY. Corn will likely be a follower of what soybeans do as US stocks are plentiful at over 2.15 bil. bu. with a record export forecast to live up to and a seemingly optimistic feed usage estimate at 6.1 bil. bu.
SOYBEANS
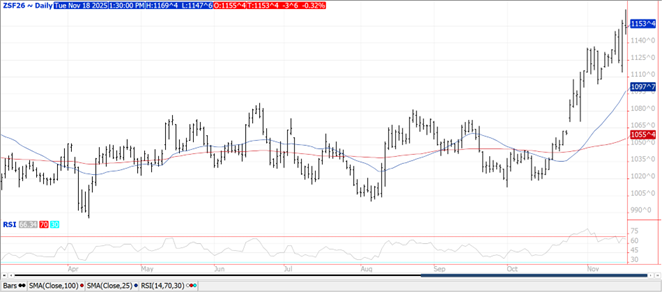
Prices were sharply mixed across the complex with beans $.02-$.04 lower, meal was off $3-$4 per ton while oil was up a full penny. Bean and meal spreads weakened while oil spreads firmed. Overnight strength in Jan-26 beans enabled prices to work into a gap on the chart from the spring of 2024. It would take a move up to $11.90 to fill this gap. Dec-25 oil jumped out to a 2 month high while pretty much closing right at its 100 day MA. Inside trade for Dec-25 meal as it held support near the old resistance near $325. Classic case of “buy the rumor, sell the fact” trade in soybeans today after the USDA confirmed a large 792k mt Chinese purchase of US soybeans. US soybean harvest at 95% as of Sunday compares to 98% YA and the 5-year Ave. of 96%. NE is only 84% harvested vs. 100% Ave. while KS is 91% vs. Ave. of 94%. Known bean sales to China sit at around 1.1 – 1.2 mmt, with a couple hundred thousand tons of additional sales to unknown. Some estimate recent sales may ultimately reach 2 mmt or more. Further sales (or lack thereof) will continue to drive price volatility. EU soybean imports as of Nov. 16th at 4.4 mmt are down 16% YOY while meal imports at 6.74 mmt are down 8.5%. Yesterday’s massive NOPA crush figure from Oct-25 would suggest the current USDA crush est. for 2025/26 MY at 2.555 bil. bu. is too low. Look for a 25-50 mil. bu. increase in the Dec-25 WASDE update. The US balance sheet is looking tighter nearly every day. ABIOVE lowered their 25/26 Brazilian production est. .8 mmt to 177.7 mmt, still just above the USDA forecast of 175 mmt. ABIOVE is forecasting Brazil’s crush at 60.5 mmt and exports at 111 mmt vs. the USDA est. of 59 mmt and 112.5 mmt respectively. Question becomes how much over Brazil soybeans will China be willing to pay for US beans, which will go a long way at determining how high prices can go with currently no major weather threat in SA.
WHEAT
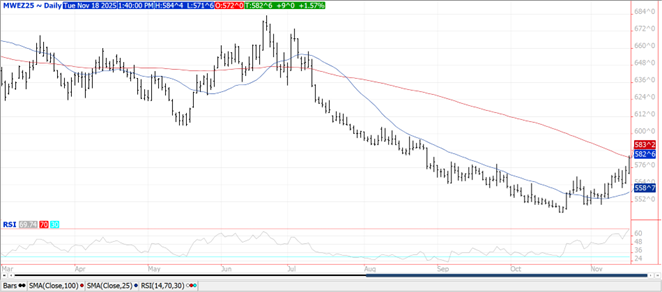
Prices ranged from $.02 lower in spot KC to $.09 higher in spot MIAX. Spreads firmed in CGO and MIAX while weaker in KC. Dec-25 MIAX has traded to a fresh 2 ½ month high while closing at its 100 day MA resistance. No confirmation of US sales to China after rumors of their interest surfaced yesterday. Jordan reported bought 60k mt of wheat in their recent 120k mt tender. No prices details yet available. US winter wheat plantings have reached 92%, just below the YA pace and 5-year Ave. of 94% and 95% respectively. Winter wheat ratings at only 45% G/E are well below analysts’ expectations during the Govt. shutdown and below the 49% from YA. EU 25/26 soft wheat exports as of Nov. 16th at 9.05 mmt are slightly below YA at 9.09 mmt. The 8.6% YOY increase in production from S. Hemisphere exporters will limit US export opportunities.
Charts provided by QST.
Risk Warning: Investments in Equities, Contracts for Difference (CFDs) in any instrument, Futures, Options, Derivatives and Foreign Exchange can fluctuate in value. Investors should therefore be aware that they may not realise the initial amount invested and may incur additional liabilities. These investments may be subject to above average financial risk of loss. Investors should consider their financial circumstances, investment experience and if it is appropriate to invest. If necessary, seek independent financial advice.
ADM Investor Services International Limited, registered in England No. 2547805, is authorised and regulated by the Financial Conduct Authority [FRN 148474] and is a member of the London Stock Exchange. Registered office: 3rd Floor, The Minster Building, 21 Mincing Lane, London EC3R 7AG.
A subsidiary of Archer Daniels Midland Company.
© 2021 ADM Investor Services International Limited.
Futures and options trading involve significant risk of loss and may not be suitable for everyone. Therefore, carefully consider whether such trading is suitable for you in light of your financial condition. The information and comments contained herein is provided by ADMIS and in no way should be construed to be information provided by ADM. The author of this report did not have a financial interest in any of the contracts discussed in this report at the time the report was prepared. The information provided is designed to assist in your analysis and evaluation of the futures and options markets. However, any decisions you may make to buy, sell or hold a futures or options position on such research are entirely your own and not in any way deemed to be endorsed by or attributed to ADMIS. Copyright ADM Investor Services, Inc.
