Written Commentary
CORN
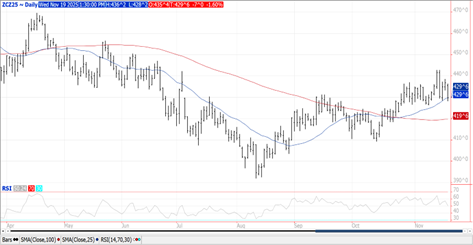
Prices were $.06-$.08 lower today while spreads were mixed. Dec-25 traded to a new low for the week while closing at its 50 day MA. Next support is at the 100 day MA at $4.19 ¾. The USDA reported the delayed census export data from Aug-25 which was originally scheduled for release Oct. 7th. Corn exports at 252 mil. bu. were up 24% from YA and a record high for the month. EIA data show ethanol production increased to 1,091 tbd, or 321 mil. gallons in the week ended Fri. Nov. 14th, up from 316 mil. the previous week however down 1.7% from YA. There was 109 mil. bu. of corn used in the production process, or 15.53 mil. bu. per day, just above the 15.36 mbd needed to reach the USDA corn usage estimate of 5.60 bil. bu. Ethanol stocks inched up to 22.3 mil. barrels, in line with expectations while below YA at 22.6 mb. Implied gasoline usage last fell 5.5% to 8.528 tbd, however was up 1.3% YOY. Tomorrow’s export sales report will cover the week ended Oct. 2nd. Traders expect sales for the week ended Nov. 13th to range between 55-95 mil. bu. This sales data will be released on Dec. 11th.
SOYBEANS
Prices were lower across the complex with beans down $.11-$.17, meal was off $4-$8 while oil was down just over $.01 lb. Spreads were also weaker across the complex. Jan-26 beans closed $.33 off yesterday’s 17 month high and at the midpoint of this month’s range. Dec-25 oil gave back all of yesterday’s gains however held support above the 50 day MA at 50.40. Dec-25 meal fell back to the lower end of this month’s range. While the USDA announced another 330k mt of soybeans sold to China, announced sales so far this week at 1.122 mmt are well shy of the rumored 2 mmt. Spot board crush margins plunged $.12 to a 5 month low at $1.27 ½ bu. on the potential delay in feedstock import limits. Bean oil PV however ticked up to 44.5%. Census soybean exports in Aug-25 at 83.5 mil. bu. were up 30% from July-25 and Aug-24. Much like ABIOVE did yesterday, Safras & Mercado lowered their Brazilian production forecast today by 2.1 mmt to 178.8 mmt, still slightly above the USDA record forecast of 175 mmt. Safras & Mercado have planted acres up 1.4% from YA to 48.31 mil. HA (119.4 mil. acres) vs. the USDA at 48.8 mil. HA. S&M average yield at 3.72 ton/HA is well above the USDA’s 3.59 ton/HA yield. How much US soybeans China is willing to buy over cheaper offers from Brazil will go a long way in determining if we have seen prices peak. Continued sales to China would largely be for political reasons, not based on economics as US FOB offers are nearly $1 bu. over Brazilian offers by Feb-26 as we get deeper into their harvest. Trader expect sales for the week ended Nov. 13th to range between 25-55 mil. bu. for soybeans, 150-350k tons for meal and 0-25k tons of oil.

WHEAT
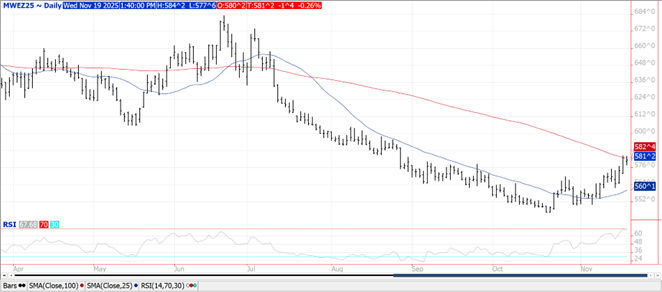
Prices ranged from $.02 lower in MIAX futures to $.11 lower in KC. Despite the weakness spreads were steady to firmer. Inside trade for Dec-25 MIAX as it held close to its 100 day MA. Dec-25 KC closed near its 50 day MA support at $5.15. Census wheat exports in Aug-25 at 99 mil. bu. were up 10% YOY and the highest for the month in 9 years. June thru August exports (Q1 25/26 MY) at 248 mil. are a 5 year high and up 14% YOY. Ukraine’s Economic Minister has suggested his country will not restrict wheat exports for the balance of the 25/26 MY. They estimate 25/26 production at 23 mmt, matching the USDA however forecast exports at 17 mmt, above the USDA est. at 15 mmt. To date their exports at only 6.8 mmt are off 21% from YA. Export sales for the week ended Nov. 13th are expected to range between 12-22 mil. bu.
Charts provided by QST.
Risk Warning: Investments in Equities, Contracts for Difference (CFDs) in any instrument, Futures, Options, Derivatives and Foreign Exchange can fluctuate in value. Investors should therefore be aware that they may not realise the initial amount invested and may incur additional liabilities. These investments may be subject to above average financial risk of loss. Investors should consider their financial circumstances, investment experience and if it is appropriate to invest. If necessary, seek independent financial advice.
ADM Investor Services International Limited, registered in England No. 2547805, is authorised and regulated by the Financial Conduct Authority [FRN 148474] and is a member of the London Stock Exchange. Registered office: 3rd Floor, The Minster Building, 21 Mincing Lane, London EC3R 7AG.
A subsidiary of Archer Daniels Midland Company.
© 2021 ADM Investor Services International Limited.
Futures and options trading involve significant risk of loss and may not be suitable for everyone. Therefore, carefully consider whether such trading is suitable for you in light of your financial condition. The information and comments contained herein is provided by ADMIS and in no way should be construed to be information provided by ADM. The author of this report did not have a financial interest in any of the contracts discussed in this report at the time the report was prepared. The information provided is designed to assist in your analysis and evaluation of the futures and options markets. However, any decisions you may make to buy, sell or hold a futures or options position on such research are entirely your own and not in any way deemed to be endorsed by or attributed to ADMIS. Copyright ADM Investor Services, Inc.
