Written Commentary
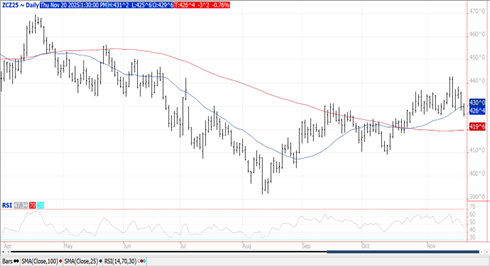
CORN
Prices were $.03-$.04 lower in choppy 2 sided trade. Spreads continue to firm as Dec/Mch traded to a 9 month high at -.10 ¾. Dec-25 traded into a new low for the month with next support is the 100 day MA at $4.19 ¾. CFTC data as of Sept.30th showed MM’s short 135k contracts of corn, best guess that is down to 87k at present. Export sales in the week ended Oct. 2nd at 89 mil. bu. brought YTD commitments to 1.157 bil. up 67% from YA, vs. the current USDA forecast of up 9%. Using the mid-point of the weekly Ave. estimates over the past 5 weeks would place commitments at a record 1.459 bil. bu. up 24% from YA. South Korean feed groups have been actively buying global feed corn. Total volume purchased was reportedly around 330k mt from US, SA or South Africa origin. The IGC raised their 25/26 global corn production forecast 1 mmt to 1.298 bil. mt’s, 1% above the USDA est. of 1.286 bmt.
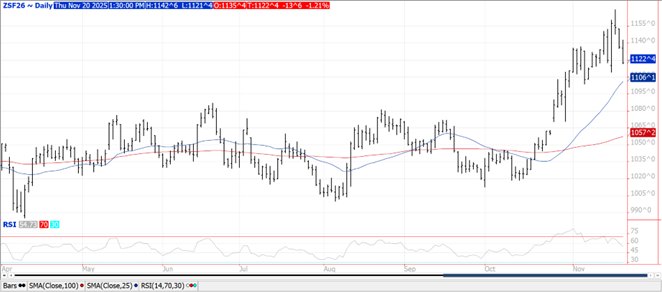
SOYBEANS
Prices were moderately lower across the complex with several contracts closing near session lows. Beans were down $.09-$.14, meal was off $3-$5 while oil was down 45 points. Bean and meal spreads weakened while oil spreads were flat. Jan-26 beans finished $.47 off this week’s 17 month high. Support is at this week’s low of $11.14 ¼. Support for Dec-25 meal is at the 50 day MA at $310.90. Support for Dec-25 oil also at the 50 day MA at 50.39. The USDA announced another flash sale of 462k mt (17 mil. bu.) to China bringing this week’s total to 1.584 mmt and just over 1.8 mmt this month, 15% of the 12 mmt the Trump Admin. claims China has agreed to purchase for the 2025/26 MY. Chinese customs data showed that of their record Oct-25 soybean imports of 9.5 mmt, none had come from the US for a 2nd consecutive month. 7.1 mmt were from Brazil with 1.6 coming from Argentina. Thru the first 10 months of 2025 total Chinese imports sit at 95.7 mmt with 71 mmt coming from Brazil while only 16.8 from the US. These totals will begin to start shifting back to the US a bit. As of Sept. 30th MM’s were net short 39k contracts of soybeans, nearly 118k meal and just over 1k oil. At present we feel the position in soybeans has flipped to net long 100k contracts, still short 70k contracts of meal and long 14k bean oil. Soybean sales for the week ended Oct. 2nd at 34 mil. bu. brought YTD commitments to 470 mil. bu. down 36% from YA. The current USDA forecast at 1.635 bil. bu. is down 13% from YA. Still no commitments to China as of that week’s data. How much US soybeans China is willing to buy over cheaper offers from Brazil will go a long way in determining if we have seen prices peak. While US beans remains competitive with Brazil in the spot FOB market, Brazil’s discount to US by Feb-26 has stretched out to nearly $1 bu.
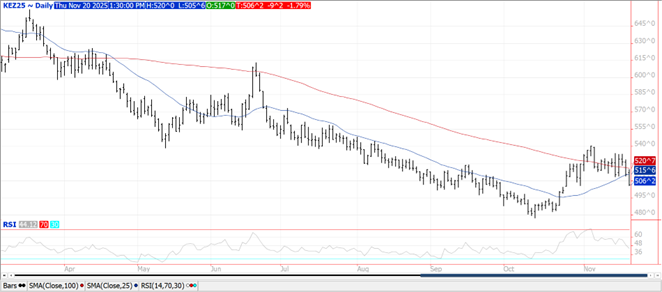
WHEAT
Prices were $.08-$.10 lower across the 3 classes at midday. Spreads also weakened. Dec-25 CGO slid below both its 50 and 100 day MA however held above its November low of $5.24 ½. is holding just above its 50 day MA support at $5.29. Dec-25 KC fell to a fresh low for the month. Dec-25 MIAX has rejected trade over its 100 day MA resistance for a 3rd consecutive day. As of Sept. 30th MM’s were net short 99k contracts of CGO, 54k contracts of KC and 26k contracts of MIAX. Wheat exports in the week ended Oct. 2nd at 33 mil. bu. were a MY high bringing YTD commitments to 545 mil. bu. up 25% from YA, vs. the USDA forecast of up 9%. The USDA finally announced the sale of 132k mt (4.8 mil. bu.) of white wheat to China. Saudi Arabia is seeking 300k mt of hard milling wheat in a tender that expires tomorrow, results not expected until early next week. SovEcon raised their Russian wheat production forecast .8 mmt to 88.6 mmt, vs. the USDA est. of 86.5 mmt. The IGC raised their global wheat production forecast 3 mmt to 830 mmt, just above the USDA es.t of 828.9 mmt.
Charts provided by QST.
Risk Warning: Investments in Equities, Contracts for Difference (CFDs) in any instrument, Futures, Options, Derivatives and Foreign Exchange can fluctuate in value. Investors should therefore be aware that they may not realise the initial amount invested and may incur additional liabilities. These investments may be subject to above average financial risk of loss. Investors should consider their financial circumstances, investment experience and if it is appropriate to invest. If necessary, seek independent financial advice.
ADM Investor Services International Limited, registered in England No. 2547805, is authorised and regulated by the Financial Conduct Authority [FRN 148474] and is a member of the London Stock Exchange. Registered office: 3rd Floor, The Minster Building, 21 Mincing Lane, London EC3R 7AG.
A subsidiary of Archer Daniels Midland Company.
© 2021 ADM Investor Services International Limited.
Futures and options trading involve significant risk of loss and may not be suitable for everyone. Therefore, carefully consider whether such trading is suitable for you in light of your financial condition. The information and comments contained herein is provided by ADMIS and in no way should be construed to be information provided by ADM. The author of this report did not have a financial interest in any of the contracts discussed in this report at the time the report was prepared. The information provided is designed to assist in your analysis and evaluation of the futures and options markets. However, any decisions you may make to buy, sell or hold a futures or options position on such research are entirely your own and not in any way deemed to be endorsed by or attributed to ADMIS. Copyright ADM Investor Services, Inc.
