Written Commentary
CORN
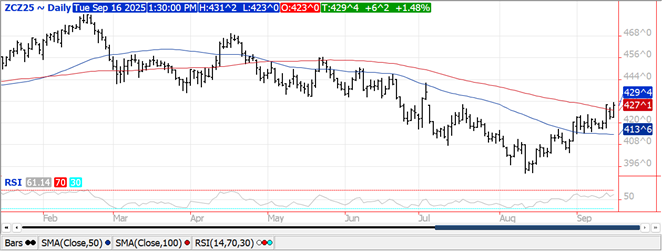
Prices were $.05-$.06 higher while spreads also firmed. Dec-25 crossed back above its 100 day MA while trading to a 2 month high. Crop ratings fell 1% to 67% G/E, in line with expectations. Declines were widespread with 12 states reporting a drop in ratings, 4 showed improvement while 2 held steady. Since peaking in early July ratings have been on a steady downtrend however remain the highest since 2018. 85% of the crop is dented while 41% is mature, both in line with recent history. Harvest progress at 7% matches the 5-year Ave. however just shy of the 8% pace from YA. EU 2025/26 corn imports as of Sept. 14th at 2.52 mmt are down 43.5% from YA. No doubt early summer heat and late summer dryness has impacted this year’s corn crop. Its impact has probably been most felt in Illinois where ratings have fallen to their lowest level since 2019.
SOYBEANS
Prices were higher across the complex with beans up $.07-$.08, meal was steady to $1 higher while oil was up 90-95 points. Bean spreads weakened while product spreads were mixed. Nov-25 beans stretched out to a fresh 2 week high while closing just below the $10.50 level. Next resistance is at the Aug-25 high of $10.62 ¾. Oct-25 oil jumped to a new high for the month with the rally stalling right at its 50 day MA. Oct-25 meal remains stuck between its 50 and 100 day MA’s of $281 and $289.40. Spot board crush margins improved $.04 ½ to $1.65 while bean oil PV improved to 48.2%. Near the close wire services reported the EPA will seek public comment whether to reallocate zero, 50% or even 100% of the exempted biofuels onto larger refineries. At stake is roughly 1.1 bil. gallons. Whatever volume the EPA decides to try and reallocate will likely be challenged in court by big oil, possibly tied up for months if not years. Soybean ratings fell 1% to 63% G/E, also in line with expectations. Ratings fell in 14 states, improved in 3 while holding steady in 1. By my count 75% of the states reported record pod counts for the month of Sept. 41% of the crop is dropping leaves, in line with recent history. Harvest progress at 5% is just below YA at 6% however above the 5-year Ave. of 3%. NOPA members processed nearly 190 mil. bu. in Aug-25, well above expectations implying census crush at 198 mil. bu. This would take total crush for 2024/25 to 2.445 bil., 15 mil. bu. above the current USDA estimate. Oil stocks at 1.245 bil. lbs. were below expectations of 1.298 bil. Above kept their Brazilian 25/26 bean production est. unchanged at 170.3 mmt, below the USDA est. of 175 mmt. They raised their crush forecast .4 mmt to 58.5 mmt while holding their export forecast unchanged at 109.5 mmt. EU bean imports as of Sept 14th at 2.67 mmt are down 3.6% YOY. Meal imports at 3.76 mmt are down 4.6%. Illinois soybean ratings have also dropped to their lowest level since 2019.

WHEAT
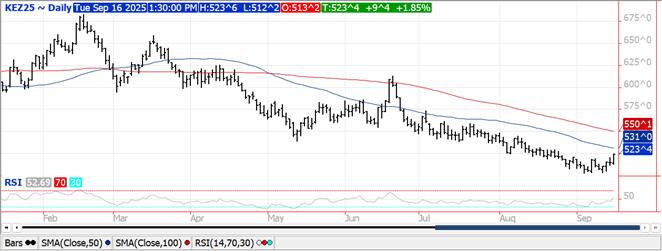
Prices ranged from $.04 – $.09 higher across the 3 classes today. Spreads were steady. Dec-25 contracts in KC and CGO stretched out to a new high for the month. Next resistance for CGO is the 50 day MA at $5.39 ¼. Resistance for KC is at $5.31. The US $$ fell to a 2 ½ month low as the FOMC began their 2 day meeting where a 25 bp cut in the Fed Funds rate is widely expected after tomorrow’s meeting. US winter wheat plantings at 11% are behind the 5-year Ave. and YA pace of 13%. Spring wheat harvest is approaching the finish line at 94% complete. Jordan passed on their 120k mt wheat tender that closed today. Asian sources indicate that with delays in shipments from the Black Sea region along with competitive offers from the US, many countries have turned to the US for wheat imports. Helps solidify the USDA decision to raise exports 25 mil. bu. in last week’s WASDE. EU soft wheat exports as of Sept 14th at 3.78 mmt are down 34% YOY.
Charts provided by QST.
Risk Warning: Investments in Equities, Contracts for Difference (CFDs) in any instrument, Futures, Options, Derivatives and Foreign Exchange can fluctuate in value. Investors should therefore be aware that they may not realise the initial amount invested and may incur additional liabilities. These investments may be subject to above average financial risk of loss. Investors should consider their financial circumstances, investment experience and if it is appropriate to invest. If necessary, seek independent financial advice.
ADM Investor Services International Limited, registered in England No. 2547805, is authorised and regulated by the Financial Conduct Authority [FRN 148474] and is a member of the London Stock Exchange. Registered office: 3rd Floor, The Minster Building, 21 Mincing Lane, London EC3R 7AG.
A subsidiary of Archer Daniels Midland Company.
© 2021 ADM Investor Services International Limited.
Futures and options trading involve significant risk of loss and may not be suitable for everyone. Therefore, carefully consider whether such trading is suitable for you in light of your financial condition. The information and comments contained herein is provided by ADMIS and in no way should be construed to be information provided by ADM. The author of this report did not have a financial interest in any of the contracts discussed in this report at the time the report was prepared. The information provided is designed to assist in your analysis and evaluation of the futures and options markets. However, any decisions you may make to buy, sell or hold a futures or options position on such research are entirely your own and not in any way deemed to be endorsed by or attributed to ADMIS. Copyright ADM Investor Services, Inc.
