Written Commentary
CORN
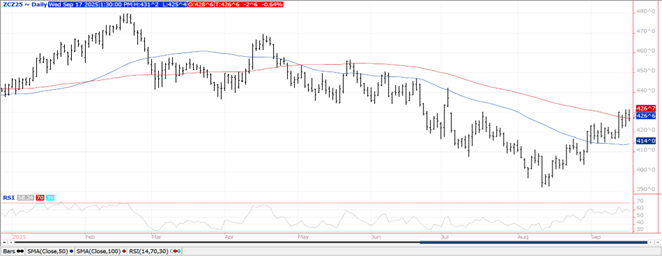
Prices backed up $.02-$.03 in 2 sided trade. Spreads closed steady. Dec-25 close right at its 100 day MA at $4.26 ¾. Ethanol production slipped to 310 mil. gallons in the week ended Fri. Sept. 12th, down from 325 mil. the previous week however up .6% from YA. Production was the lowest in 17 weeks and below expectations. There was 105 mil. bu. of corn used in the production process, or 15.0 mil. bu. per day, well below the 15.34 mbd needed to reach the USDA 25/26 corn usage forecast of 5.60 bil. bu. Ethanol stocks slumped to 22.6 mil. barrels, at the low end of expectations and below YA inventories at 23.8 mb. Implied gasoline demand rose 3.5% to 8.81 tbd, and was up .4% YOY. Stats Canada est. their corn production at 15.5 mmt, in line with the USDA. Speculative traders yesterday reportedly bought 16k contracts cutting their net short position to around 76k contracts. O.I surged almost 25k contracts, so perhaps an indication it wasn’t speculators covering shorts and leaving the corn market, but rather some fresh speculative longs. Tomorrow’s export sales are expected to range from 20 – 75 mil. bu. IMO at current price levels the market is building in expectations for US corn production closer to 16.5 bil., vs. the USDA forecast of 16.742 bil. and ending stocks falling close to 1.90 bil. vs. the current forecast of 2.117 bil.
SOYBEANS
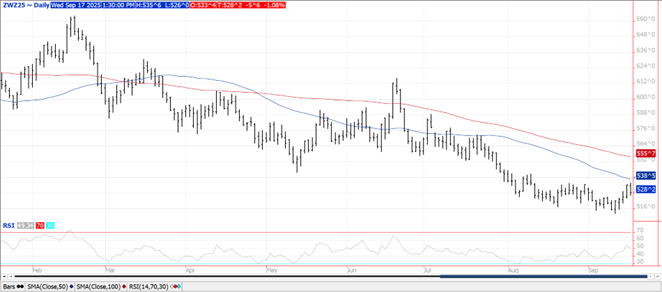
Prices are mostly lower with beans off $.06, meal ranged from down $2 to up $1 while oil fell nearly $.01 1/2 lb. Spreads were mostly lower. Nov-25 beans nearly matched yesterday’s range. Initial support is at the 100 day MA at $10.30 ¾ with resistance at the Aug-25 high at $10.62 ¾. Oct-25 oil has slipped back below its 100 day MA closing near the midpoint of this month’s range. Outside day down for Oct-25 meal however remains between its 50 and 100 day MA’s of $281 and $289. Spot board crush margins slide $.10 ½ to $1.54 ½ bu. with bean oil PV falling to 47.5%. Late yesterday the EPA announced they would seek public comment whether to reallocate anywhere from zero to 100% of the SRE’s onto larger refineries. This period of public comment will go until the end of October with the EPA likely to issue a decision in late Nov-25 or Dec-25. Whatever the volume figure is, it will likely be challenged by big oil in court, potentially being tied up for months. The American Soybean Association supports 100% reallocation of the SRE in order to uphold the integrity of the RFS. Stats Canada is forecasting canola production at 20 mmt, up from 19.24 mmt YA. The Brazilian real reached a fresh 15 month high before backing off a touch. Week 2 of the outlook brings better prospects for moisture across WC growing areas of Brazil, favorable as soybean planting begin to accelerate. Export sales are expected to range between 15-55 mil. bu. of beans, 100-350k tons of meal and -5-40k tons of oil. A lot of important items continue to stack up this fall and early winter period. Pres. Trump and Chinese Pres. Xi are expected to speak this Friday with hopes of a face to face meeting this fall to carve out a trade deal. The US Supreme court is expected to hear arguments on the legality of the Trump Admin. use of tariffs and now the delay in SRE reallocation. And all the while US farmer harvest what’s likely to be a record yielding crop.
WHEAT
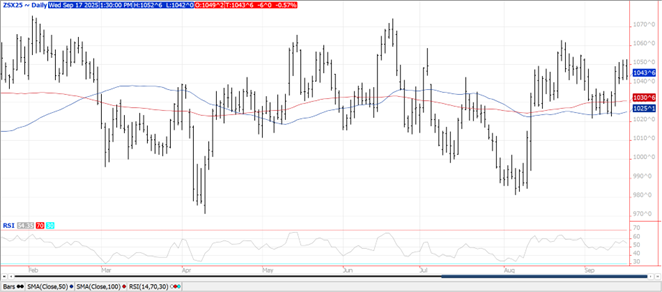
Prices ranged from $.02 – $.07 lower across the 3 classes in 2 sided trade. Spreads have also weakened. Both KC and CGO Dec-25 contracts rejected trade into new highs for the month. Overhead resistance for CGO rests at its 50 day MA at $5.38 ½, $5.30 ½ for KC. Rains this week in the western corn belt won’t have much impact on this year’s corn or soybean yields, however will help recharge soil moisture for this year’s winter wheat crop. Stats Canada raised their all-wheat production forecast 1.1 mmt to 36.624 mmt, consistent with the USDA last week raising their forecast 1 mmt to 36 mmt. Russia’s Ag. Ministry raised their wheat export duty nearly 300% to 495.9 roubles/mt. The higher tax is in effect from Sept. 17th thru the 23rd. Export sales are expected to range from 10-24 mil. bu.
Charts provided by QST.
Risk Warning: Investments in Equities, Contracts for Difference (CFDs) in any instrument, Futures, Options, Derivatives and Foreign Exchange can fluctuate in value. Investors should therefore be aware that they may not realise the initial amount invested and may incur additional liabilities. These investments may be subject to above average financial risk of loss. Investors should consider their financial circumstances, investment experience and if it is appropriate to invest. If necessary, seek independent financial advice.
ADM Investor Services International Limited, registered in England No. 2547805, is authorised and regulated by the Financial Conduct Authority [FRN 148474] and is a member of the London Stock Exchange. Registered office: 3rd Floor, The Minster Building, 21 Mincing Lane, London EC3R 7AG.
A subsidiary of Archer Daniels Midland Company.
© 2021 ADM Investor Services International Limited.
Futures and options trading involve significant risk of loss and may not be suitable for everyone. Therefore, carefully consider whether such trading is suitable for you in light of your financial condition. The information and comments contained herein is provided by ADMIS and in no way should be construed to be information provided by ADM. The author of this report did not have a financial interest in any of the contracts discussed in this report at the time the report was prepared. The information provided is designed to assist in your analysis and evaluation of the futures and options markets. However, any decisions you may make to buy, sell or hold a futures or options position on such research are entirely your own and not in any way deemed to be endorsed by or attributed to ADMIS. Copyright ADM Investor Services, Inc.
