Macroeconomics: Equity markets had one of their best days in history today, and the largest gain in the Dow (+8%) , the S&P 500 ( +9.3%) and the NASDAQ (+12.4%). President Trump raised tariffs on China from 104% to 125% and lowered all other countries reciprocal tariffs to the 10% baseline increase. Trump made statements following the announcement that he was watching the bond markets last night and Jamie Diamond’s interview this morning and felt that people were “getting yippy”. If you’re a golfer that’s a common term for ‘nervous’. He even showed his hand a bit this morning by telling people to buy the market and not to panic. All other countries subject to reciprocal tariffs (excluding China) will have 90 days to negotiate trade policies. Notable to say oil is back above $60/barrel, and gold jumped over $100/ounce today even prior to Trump’s announcement. Ag Fundamentals: USDA WASDE report will be out tomorrow at 11:00am CST. Ethanol production was lower than expected today at 7.147 million barrels last week. Ethanol breakdown can be seen below. Following Trump’s announcement corn jumped 7¢ and soybeans spiked 26¢ intraday. Aside from the report tomorrow, ag trader are waiting to see what China’s response will be following the increase in tariffs.
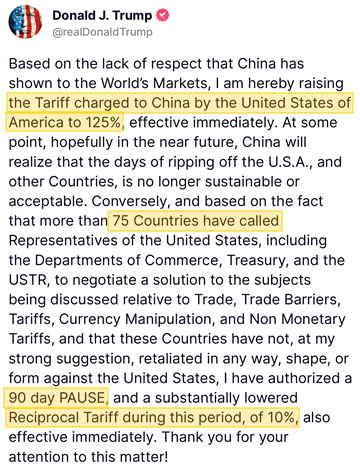
President Trump’s Post below was sent out on Truth Social at 12:18pm today and caused the market to spike higher. Two main takeaways are the increase to China tariffs from 104% to 125% and the lowering of lowering of all other countries reciprocal tariff to the baseline 10%.
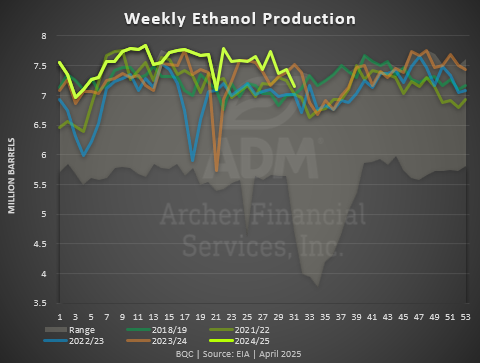
EIA Weekly Ethanol Production (for week ending 4/4/2025)
Ethanol Production hit a 10-week low, dropping -42K barrels per day week-over-week. Spot ethanol margins were also down slightly to close to 12¢/gallon.
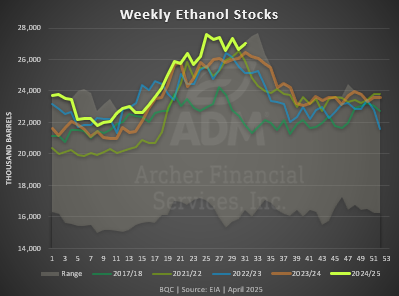
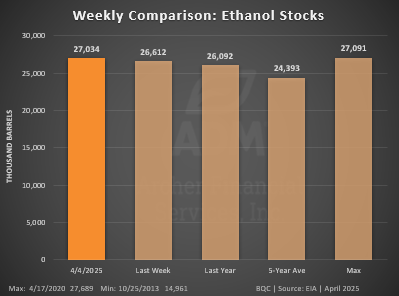
EIA Weekly Ethanol Stocks
Ethanol Stocks rose 422 thousand barrels to 27.034 million barrels.
EIA Weekly Implied Corn Usage
Corn Usage was down 4.22 million bushels week-over-week. This was 260K bushels less than the weekly 14.86 million bushels needed to reach the USDA ethanol estimate of 5.554 for the year.
Risk Warning: Investments in Equities, Contracts for Difference (CFDs) in any instrument, Futures, Options, Derivatives and Foreign Exchange can fluctuate in value. Investors should therefore be aware that they may not realise the initial amount invested and may incur additional liabilities. These investments may be subject to above average financial risk of loss. Investors should consider their financial circumstances, investment experience and if it is appropriate to invest. If necessary, seek independent financial advice.
ADM Investor Services International Limited, registered in England No. 2547805, is authorised and regulated by the Financial Conduct Authority [FRN 148474] and is a member of the London Stock Exchange. Registered office: 3rd Floor, The Minster Building, 21 Mincing Lane, London EC3R 7AG.
Futures and options trading involve significant risk of loss and may not be suitable for everyone. Therefore, carefully consider whether such trading is suitable for you in light of your financial condition. The information and comments contained herein is provided by ADMIS and in no way should be construed to be information provided by ADM. The author of this report did not have a financial interest in any of the contracts discussed in this report at the time the report was prepared. The information provided is designed to assist in your analysis and evaluation of the futures and options markets. However, any decisions you may make to buy, sell or hold a futures or options position on such research are entirely your own and not in any way deemed to be endorsed by or attributed to ADMIS. Copyright ADM Investor Services, Inc.