Written Commentary
MONTHLY COMMODITIES MARKET OVERVIEW
>>Read the complete December 2025 Edition HERE
KEY HIGHLIGHTS
GRAINS
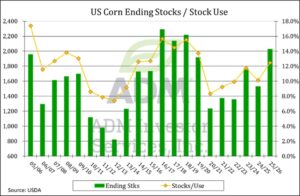
Since peaking in mid-November, corn prices have held inside a 20-cent range, despite the volatility in the soybean complex and a moderately bullish December WASDE report. In that report the USDA lowered US 2025/26 ending stocks by 125 million bushels to 2.029 billion, which while still a seven-year high were 95 million bushels below expectations. Corn exports were increased another 125 million bushels to a record 3.2 billion. Usage for ethanol production and feed were left unchanged. Global stocks were lowered by 2 million metric tons to 279.2 million, largely due to the reduced US inventories. USDA held off on making any changes to South American production. Production in Ukraine was lowered 3 million metric tons to 29 million, while EU production was raised by 1 million tons to 56.8 million. The stocks/use ratio among global exporters for 2025/26 fell to 9.7% from 10.1% in the November update. As we wind down 2025, markets will continue to focus on South American weather and US demand.
Although China appears to be holding to their commitment to purchase 12 million metric tons of US soybeans by the end of February, prices across the soybean complex have sold off sharply from their November highs. Favorable weather conditions in South America combined with speculative selling has fueled the pullback. CFTC Commitment of Traders data , which has been delayed due to the US government shutdown, has revealed that much of the price surge from mid-October into November was largely due to massive speculative buying, particularly in soybeans and soybean meal.
A month ago I wrote that unless bullish developments in other markets or the war in Ukraine threatens the supply of wheat from the Black Sea region, I would look for prices to drift back toward their October lows. That’s exactly what happened across all three classes, with spot Chicago and Minneapolis Wheat both falling to fresh contract lows. The price jump from late October into early November was largely the result of speculative short covering. In recent weeks we have seen the combined money manager short position across the three classes drop from 208,000 contracts to just under 82,000. Once the short covering stopped, prices fell back into their long-term bear market pattern.
COCOA
At its low in November, nearby cocoa had retraced 65.4% of its rally from an all-time low of $674 per metric ton from December 2000 to its all-time high of $12,931/ton from January, 2025, and that decline may have been enough of a correction to support the market for a while. After a slow start this fall, cocoa arrivals at Ivory Coast ports picked up steam, and as of December 14 they had been above year ago and five year average levels for seven out of the previous eight weeks. This brought some relief to those worried about a small crop this year. Cumulative arrivals for the 2025/26 marketing year had reached 894,000 tons, close to the 895,000 from a year prior but behind the five year average at 991,000.
COFFEE
Coffee prices plunged when the Trump Administration canceled the 50% tariff on Brazilian coffee, but the market quickly bounced, putting in a spike low on November 21. Up until this week that market had not come near that low, as the removal of the tariffs likely brought pent-up buying by US roasters and importers. There also been some reassessments of the 2025/26 Brazilian crop, with Conab raising its estimate to 56.5 million bags, up from 55.2 million estimated in September and up 4.3% from the previous year. The arabica crop was pegged at 35.76 million bags, up from 35.15 million in the previous forecast, and robusta output was seen at 20.77 million bags, up from 20.05 million and a new record. Crop prospects for 2026/27 are looking better as well, with the key arabica-growing regions seeing ample rainfall this month.
COTTON
Ample supply and dismal export sales have left the cotton market with little fundamental support aside from the possibility that low prices will spark demand and discourage production. The Commitments of Traders reports have shown the funds loading up on short positions, leaving the market vulnerable to short covering if any bullish news develops. Based on data from the USDA December WASDE report, the US 2025/26 cotton stocks/use ratio is estimated at 32.6%, the highest in five years, and the world ratio is estimated at 64.1%, the highest since 2022/23. USDA is still working to fill in the backlog of export sales reports that were postponed during the government shutdown, but as of November 20, cumulative cotton sales for 2025/26 had reached just 5.589 million bales, down from 6.364 million at that time last year and the slowest in 11 years.
SUGAR
Recent Commitments of Traders data showed that as of November 25, managed money traders were net short 200,074 contracts of sugar, which was very large and left the market vulnerable to heavy short covering if resistance levels were taken out. However, it may be too much to ask for this market to build a substantial rally based sole on an extremely oversold position. On the fundamental side, bearish factors include good growing weather in Brazil and sugar consumption being pressured by the success in GLP-1 weight loss drugs.
CRUDE OIL
Crude oil prices came under pressure in mid-December as talks to end the conflict between Russia and Ukraine developed a surprisingly optimistic tone. As of this writing the Trump Administration had reportedly offered a “NATO-like” security agreement to Ukraine, which was appealing to that country even if it did not include full membership. There was no word on how Russia viewed that offer. The issue of land concessions had yet to be resolved. Russia was insisting they be allowed to keep all the land they had taken and then some, which is something that would Ukraine’s leadership would find difficult to accept. If the plan is successful, it would likely mean a lifting of the sanctions on Russia and therefore a more free-flowing movement of Russian oil.
NATURAL GAS
Natural gas prices saw a sharp rally during late November/early December that lifted the nearby contract to its highest level since December 2022, only to give back all of those gains and then some within the span of seven sessions. The market was supported on its rally from an early start to winter that bought heavy snows to the Midwest around Thanksgiving and extreme cold in the first two weeks of December. But the forecast turned, and by the end of the second week in December, the 6-10 and 8-14-day forecasts were calling for above normal temperatures across the lower 48 states out through December 29. In the meantime, US gas production continued at a record clip.
LIVE CATTLE
The December holidays are good for beef sales. The cutout improves as the top cuts, choice rib primals for rib roasts and loin primals for loin roasts and steaks move prices higher. The strong demand comes from businesses holiday events, families having beef roasts during the holidays, and from restaurant sales out through New Year’s Eve. About 70% of prime rib roasts annually are sold during the holidays.
LEAN HOGS
Hog prices peaked when the September Hogs and Pigs report was released on September 26. From September 26 to November 21, December Lean Hogs dropped $10.82. The Hogs and Pigs report showed all hogs supply was down 1% from 2024, kept for breeding down 2%, and kept for market down 1%. This wasn’t a bearish report, but pork prices fell anyway, with the CME Pork Cutout Index dropping $11.70 in the wake of the report. Since November 21 the hog market has reversed, and as of December 18 it had recovered $4.71 from the low.
STOCK INDEX FUTURES
Stock index futures have gained over the past month, with the S&P and Nasdaq posting 3% gains, while the Dow climbed nearly 5%, with the S&P and Dow both hitting all-time highs. Tech stocks connected to the AI trade have experienced moderate volatility, and that weighed on gains, while investors have seemingly been favoring cyclical stocks and have been rotating away from tech. The Federal Reserve’s December rate cut was favorable to markets, as Fed Chair Powell signaled that a cooling labor market was more of a concern than runaway inflation.
US DOLLAR INDEX
The US Dollar Index has experienced moderate volatility, primarily due to changing expectations over the monetary policy outlook leading up to and following the Fed’s December meeting, when the bank lowered rates by 25 bps. November’s CPI data came in below expectations, although it had little effect on the dollar, which has fallen around 1.2% since mid-November. The report offered some relief after months of sticky inflation, as it reinforced expectations that price pressures are cooling.
EURO CURRENCY
The euro has gained roughly 1.2% to $1.1728 over the past few weeks, as a divergence in interest rate expectations between the US Fed and the European Central Bank has been largely favorable to the euro. The European Central Bank left borrowing costs unchanged in a widely expected move, and it raised some growth projections as well. Inflation is still seen dipping below 2% next year and in 2027, mostly on lower energy costs, but it is expected to come back to target in 2028, underpinning policymakers’ arguments that no policy change was needed for now.
JAPANESE YEN
The yen has experienced moderate volatility since mid-November, initially weakening to a 10-month low in late November, as fiscal spending worries from the new administration continued to weigh negatively on the currency, dropping 0.2% to the dollar since mid-November. Speculation over a possible FX intervention did briefly support the currency, although recent support has been found in expectations that the Bank of Japan will raise interest rates at its meeting on December 19. Strong prospects for next year’s spring wage talks have been driving rate hike expectations.
INTEREST RATES
The US Treasury market has seen the curve steepen significantly since mid-November, as changing expectations for monetary policy led to a steep decline in yields in late November before climbing higher. As of this writing, the 10-year yield was roughly unchanged from mid-November. November’s CPI inflation data surprised to the downside, as consumer prices rose 2.7% year-over-year, well below forecasts of 3.1% and below September’s 3.0%. Core prices rose 2.6%, below forecasts and below September’s reading of 3.0%. Headline CPI rose 0.2% between September and November, below expectations of a 0.3% rise and a relatively slower rise than earlier in the year.
GOLD
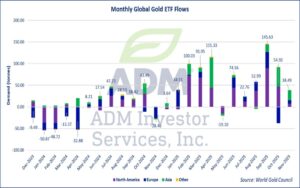
Gold has risen 8% since mid-November, as volatility in the equity markets, a weaker dollar, a reduction in interest rates, and prospects for lower monetary policy have been favorable to prices. Gold’s price direction has largely been driven by Fed interest rate expectations, with the metal advancing strongly on days when Fed speakers offered dovish remarks and following the Fed’s decision to lower interest rates by 25 bps at the beginning of December.
COPPER
US copper futures have risen roughly 9% since mid-November, as massive flows of the metal have recently been shipped to the US in anticipation that further US tariffs will be announced in mid-2026 and implemented in 2027. That dynamic has lent continued support to LME-COMEX arbitrage, as US inventories of copper are over 450,000 metric tons, while LME stocks are below 100,000 tons, and Shanghai stocks are sitting around 89,400 tons, which is in line with the yearly average.
Interested in more futures market commentary? Explore our Market Dashboards here.
