Written Commentary
CORN
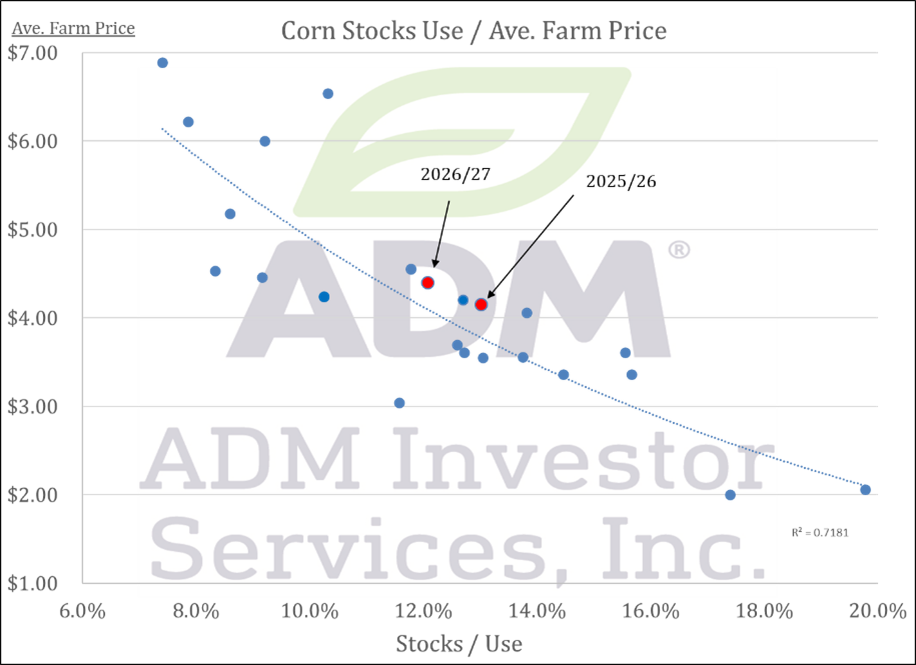
Prices were steady to $.01 higher in 2-sided trade. Spreads were mixed and little changed. Resistance for July-26 is at the recent double top at $4.87 ½. Dec-26 traded to a fresh 2 ½ year high before pulling back. China’s purchase of US corn will likely be a topic of discussion between Pres. Trump and Chinese leader Xi. The USDA did up their 26/27 corn export forecast 50 mil. bu. to 3.150 bil. despite raising their SA production forecast 10 mmt. The US House is expected to vote this week on legislation to allow the year-round sale of E-15. Surging wheat prices has provided support to corn as wheat will quickly work its way out of feed rations trading $2 over corn. Ethanol production spiked to 318 mil. gallons in the week ended May 8th, up from 299 mil. the previous week while up 9% YOY. There was 106 mil. bu. of corn used, or 15.2 mil. bu. per day, below 15.7 needed to reach the USDA forecast of 5.60 bil. Ethanol stocks slipped to 24.9 mil. barrels, below 25.4 mb from YA. Stocks/use among major exporting countries rose to a 7-year high at 11.3% for the 25/26 MY, while slipping to 10.5% for 26/27 MY. The USDA Ave. Farm price forecast at $4.40 would seem a bit high with the 12.1% stock/use ratio, however IMO justified given the much higher cost of production. Tomorrow’s export sales are expected to range from 40-75 mil. bu.
SOYBEANS
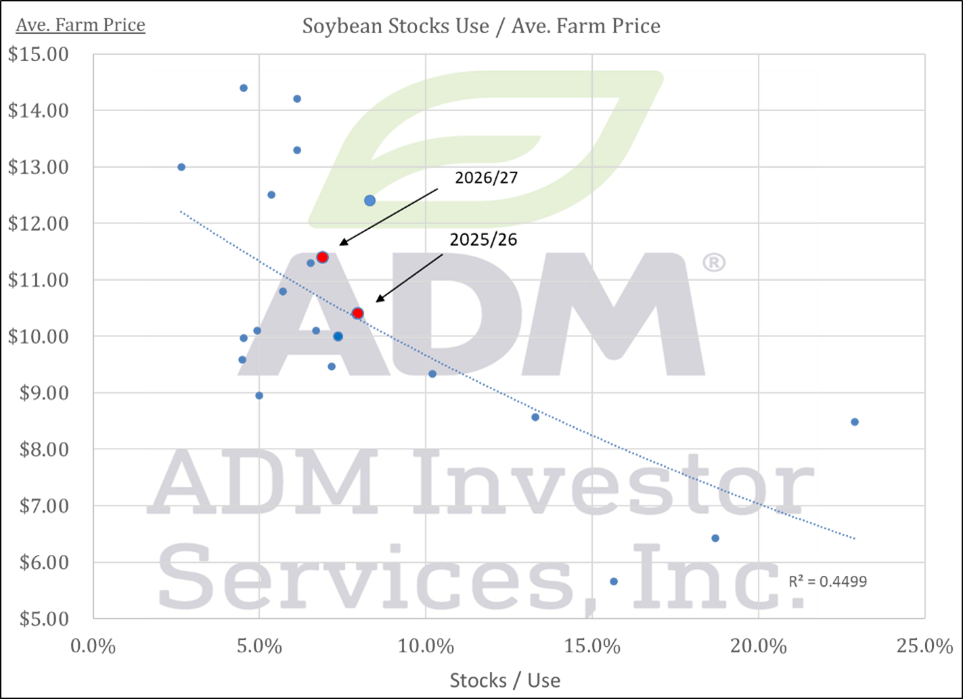
Prices were mixed with beans $.02-$.03 higher, meal surged $8-$10 while bean oil was down $.01 lb. closing near session lows. Bean spreads were mixed, oil spreads weakened while meal spreads firmed. July-26 beans jumped out to a fresh 2-month high before pulling back. Next resistance is at the March high near $12.50. Nov-26 bean traded to a 3-year high. I’d expect US farmers to be a bit more inclined to sell with futures between $12.30-$12.50 as cash prices approach the $12.00 level. July-26 meal jumped out to a 6-month high with next resistance at $343. Energy prices were lower after also experiencing 2-sided trade. The standoff between the US and Iran continues as the “fragile” ceasefire holds, while the Straits of Hormuz remains mostly closed. The markets focus will shift to Pres. Trump’s trip to Beijing where Chinese purchases of US Ag. goods is expected to be just 1 of several topics discussed by leaders from the world’s 2 largest economies. As expected, the USDA raised crush while lowering exports for both old and new crop balance sheets. New crop ending stocks at 310 mil. bu. was at the very low end of expectations, roughly 55 mil. below the Ave. estimate. With the release of the RVO mandates and SRE’s at the end of March, the USDA reversed course by raising bean oil usage for green diesel production by 200 mil. lbs. on old crop up to 14.2 bil. and up 500 mil. lbs. to 17.8 bil. for the 26/27 MY. The revised 26/27 crush forecast at 2.750 bil. bu. will push industry capacity. Crush margins were up $.09 to $3.33 ½ bu. while bean oil PV fell back to 52.3%. Conab will be out with updated Brazilian production forecasts tomorrow. Stocks/use among major exporting countries held at 19.3% for the 25/26 MY, while slipping to 18.7% for 26/27 MY, the lowest in 13 years. The USDA Ave. Farm price at $11.40 also seems high with the 6.9% stock/use ratio, however IMO justified given the higher cost of production and potential Chinese demand. Tomorrow’s export sales are expected to range from 5-20 mil. bu. of soybeans, 150-500k tons of meal and -2-12k tons of oil.
WHEAT
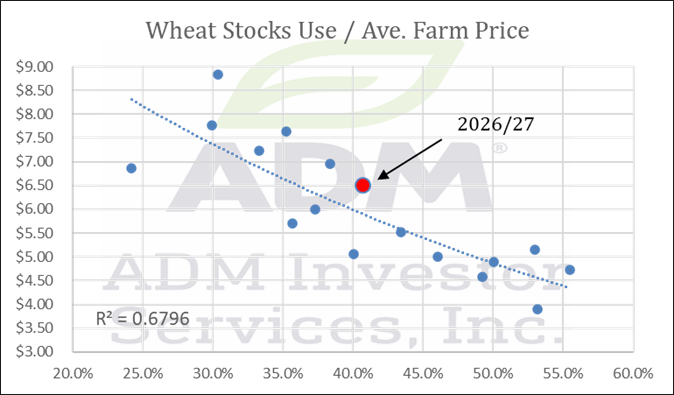
Prices turned lower, unable to hold early strength. CGO July-26 was down $.03 ½ at $6.75 1/2., KC July-26 was $.06 ½ lower at $7.24 ¾, while MIAX July-26 is down $.04 ¼ at $7.19 ¾. The rally in KC July-26 for now has been capped at $7.50. Only scattered rains for the SW plains over the next week. Above normal temperatures in the WCB will shift across the rest of the Midwest by the end of the week. Triple digit highs are possible in the SW plains this weekend. Day 1 of the winter wheat tour estimated average yields across N. Kansas at 38.3 bpa, vs. 50.5 bpa YA. Yields in E. Kansas will undoubtedly show better promise than in the west. The USDA pegged the average yield in Kansas this year at 37 bpa, down from 51 bpa last year. The USDA est. 83% of the WW acres in Kansas will be harvested for grain vs. the historical average of 92%, but still above the 71% from 2023. The USDA all wheat production forecast at 1.048 bil. was the lowest since 1965 while the HRW est. at 515 mil. bu. is the lowest since 1957. While still some growing season left, the final WW production est. has been above the initial May est. the past 3 years, including 2023, the late major drought. Production that year rose 177 mil. from May until final. The stocks/use among major exporting countries held at 18.2% for the 25/26 MY, while slipping to 16.2% for 26/27 MY. The USDA Ave. Farm price at $6.50 also seems high with the 40.7% stock/use ratio. Tomorrow’s export sales are expected to range from 6-18 mil. bu.
Risk Warning: Investments in Equities, Contracts for Difference (CFDs) in any instrument, Futures, Options, Derivatives and Foreign Exchange can fluctuate in value. Investors should therefore be aware that they may not realise the initial amount invested and may incur additional liabilities. These investments may be subject to above average financial risk of loss. Investors should consider their financial circumstances, investment experience and if it is appropriate to invest. If necessary, seek independent financial advice.
ADM Investor Services International Limited, registered in England No. 2547805, is authorised and regulated by the Financial Conduct Authority [FRN 148474] and is a member of the London Stock Exchange. Registered office: 3rd Floor, The Minster Building, 21 Mincing Lane, London EC3R 7AG.
A subsidiary of Archer Daniels Midland Company.
© 2021 ADM Investor Services International Limited.
Futures and options trading involve significant risk of loss and may not be suitable for everyone. Therefore, carefully consider whether such trading is suitable for you in light of your financial condition. The information and comments contained herein is provided by ADMIS and in no way should be construed to be information provided by ADM. The author of this report did not have a financial interest in any of the contracts discussed in this report at the time the report was prepared. The information provided is designed to assist in your analysis and evaluation of the futures and options markets. However, any decisions you may make to buy, sell or hold a futures or options position on such research are entirely your own and not in any way deemed to be endorsed by or attributed to ADMIS. Copyright ADM Investor Services, Inc.
