Written Commentary
CORN
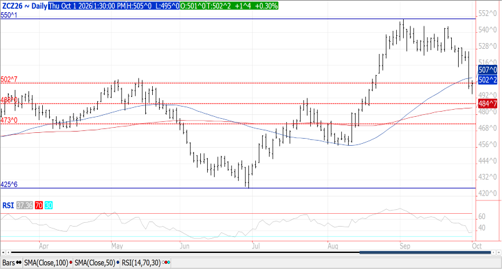
Prices recovered late to close steady to $.01 ½ higher after falling to fresh 6-week lows. Spreads also firmed. Next support for Dec-26 is $4.88, the midpoint between the June low and the September high. Yesterday’s EIA data showed ethanol production fell to 296 mil. gallons last week, the lowest in 8 months, however, in line with expectations. Ukraine’s corn exports in Sept-26 at 1.929 mmt were more than double the .913 mmt in Sept-25. Bulls remain hopeful the lower prices may stimulate demand interest from China ? The markets focus will shift back to US harvest progress (or lack thereof in WCB) and the USDA production update next Friday. Export sales at 21 mil. bu. was below expectations. YTD sales are down 31% from YA vs. the USDA forecast of down 4%. Commitments represent 23% of the USDA est. well below the historical average of 31%. Noted buyers were Mexico – 10 mil. bu. while Japan bought only 4 mil. Corn used for ethanol production is Aug-26 at 478 mil. bu. was at the high end of expectations and above 459 mil. bu. used in Aug-25.
SOYBEANS
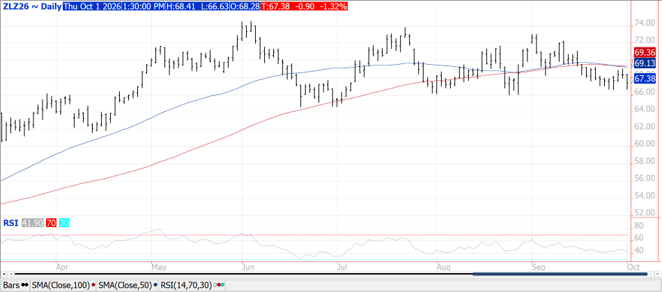
Prices were lower across the complex with beans down $.05-$.09, meal was off $2-$5 while oil was down 70-90 points. Bean spreads weakened while product spreads were mixed. Support for Nov-26 is at its 50-day MA at $12.57 ¼. Support for Dec-26 meal is at the Sept-26 low at $342.50. Dec-26 oil held support above this week’s low at 66.61. Crush margins were off $.09 at $2.34 ½ per bu. Combined biodiesel and RD production in July-26 was a record high at 528 mil. gallons up 2.6% from June. Soybean oil usage was also record high at 1.687 bil. lbs. Usage in Aug and Sept will only need to reach 1.393 bil. lb. to hit the USDA forecast of 14.80 bil. lbs. Bean sales at 38 mil. were in line with expectations. YTD commitments are up 89% from YA vs. the USDA forecast of up 11%. Sales represent 49% of the USDA forecast, above the historical average of 41%. Chinese purchases of 589k mt take commitments to 10.76 mmt. With another 6.1 mmt to unknown, I’d estimate Chinese purchases at 14 mmt. Meal sales at 162k tons were below expectations. Old crop commitments are up 16% YOY vs. the USDA forecast of up 13%. Tighter US stocks provide even less room for US yields to slip from the current USDA est. of 52.8 bpa. Census crush in Aug-26 at 210 mil. bu. was in line with expectations while bringing cumulative 2025/26 crush to 2.646 bil. bu., 9 mil. below the USDA estimate of 2.655 bil. The Ave. daily crush fell to a MY low at 6.77 mbd, down from 7.16 mbd in July, however above Aug-25 at 6.39 mbd. Soybean oil stocks fell to 1.696 bil. lbs., below expectations of 1.80 bil.
WHEAT
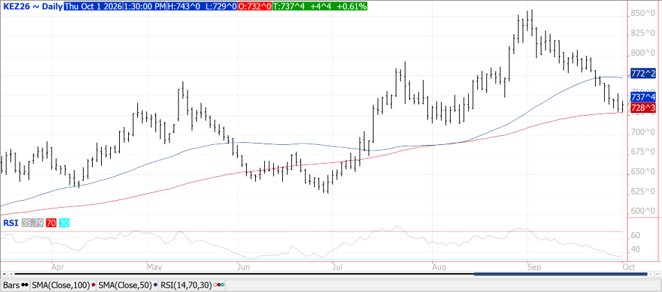
Prices recovered to close $.03-$.07 higher across the 3 classes. CGO Dec-26 was up $.07 at $6.82 ¾ after trading down to a 7-week low. Dec-26 KC was $.04 ½ higher at $7.37 ½ after holding support above its 100-day MA at $7.28 ½. Dec-26 MIAX was $.03 ½ higher at $6.96 ¾ while holding within yesterday’s range. US winter wheat acre abandonment at 33% was the highest since the Dust Bowl a century ago. Yesterday SovEcon cut Russia’s wheat export forecast another 4.7 mmt to 36.7 mmt, well below the USDA forecast of 43 mmt. Ukraine’s wheat exports in Sept-26 at 1.1 mmt were down from 2.05 YA. July-26 thru Sept-26 shipments at 2.8 mmt are down 41% YOY. Saudi Arabia tendered for 535k mt of wheat with offers due tomorrow, with results expected on Monday. US sales at 11 mil. bu. was in line with expectations. YTD commitments are down 31% from YA vs. the USDA forecast of down 15%. Commitments represent 46% of the USDA forecast, vs. the historical average of 54%. We need to see a pickup in US sales soon or the USDA will have no choice but to lower exports. US winter wheat acres in drought slipped 1% to 57% while spring wheat acres in drought fell 4 % to 48%.
Risk Warning: Investments in Equities, Contracts for Difference (CFDs) in any instrument, Futures, Options, Derivatives and Foreign Exchange can fluctuate in value. Investors should therefore be aware that they may not realise the initial amount invested and may incur additional liabilities. These investments may be subject to above average financial risk of loss. Investors should consider their financial circumstances, investment experience and if it is appropriate to invest. If necessary, seek independent financial advice.
ADM Investor Services International Limited, registered in England No. 2547805, is authorised and regulated by the Financial Conduct Authority [FRN 148474] and is a member of the London Stock Exchange. Registered office: 3rd Floor, The Minster Building, 21 Mincing Lane, London EC3R 7AG.
A subsidiary of Archer Daniels Midland Company.
© 2021 ADM Investor Services International Limited.
Futures and options trading involve significant risk of loss and may not be suitable for everyone. Therefore, carefully consider whether such trading is suitable for you in light of your financial condition. The information and comments contained herein is provided by ADMIS and in no way should be construed to be information provided by ADM. The author of this report did not have a financial interest in any of the contracts discussed in this report at the time the report was prepared. The information provided is designed to assist in your analysis and evaluation of the futures and options markets. However, any decisions you may make to buy, sell or hold a futures or options position on such research are entirely your own and not in any way deemed to be endorsed by or attributed to ADMIS. Copyright ADM Investor Services, Inc.
